
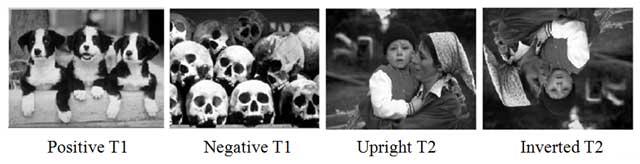
Figure 1
Example images of positive and negative T1 stimuli and upright and inverted T2 stimuli used in the RSVP task. Positive T1 and Negative T1 were coloured images in the task. Images adapted from Lang and colleagues (1999).
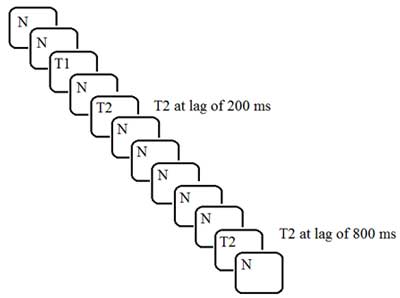
Figure 2
Schematic of the RSVP task. N= neutral image, T1 = emotionally manipulated image and T2 = target image for identification.
Table 1
Scores of Pre-Selection Questionnaires for Final Participant Set.
| BDI | LSAS | ||||
|---|---|---|---|---|---|
| Group | n | M | SD | M | SD |
| LDLA | 14 | 3.43 | 2.03 | 18.71 | 5.18 |
| LDHA | 10 | 9.1 | 3.84 | 67.5 | 13.4 |
| HDLA | 9 | 23.67 | 7.78 | 44.67 | 14 |
| HDHA | 12 | 24 | 7.24 | 74.42 | 9.97 |
[i] Note. BDI = Beck Depression Inventory, LSAS = Liebowitz Social Anxiety Scale, LD = low depression, HD = high depression, LA = low anxiety, HA = high anxiety.
Table 2
Mean Scores for Accuracy, Reaction Time, and Pupil Diameter.
| Accuracy | Reaction Time (ms) | Pupil Diameter (μm) | |||||
|---|---|---|---|---|---|---|---|
| Negative | Positive | Negative | Positive | Negative | Positive | ||
| Group | Lag | M | M | M | M | M | M |
| LDLA | 2 | .702 | .710 | 2731.510 | 2717.379 | 3.746 | 3.746 |
| 8 | .720 | .716 | 2701.618 | 2696.637 | 3.739 | 3.733 | |
| LDHA | 2 | .711 | .793 | 2592.646 | 2622.928 | 3.997 | 4.000 |
| 8 | .690 | .699 | 2629.113 | 2638.778 | 4.034 | 4.007 | |
| HDLA | 2 | .711 | .741 | 2873.307 | 2846.720 | 3.715 | 3.727 |
| 8 | .704 | .704 | 2832.253 | 2794.668 | 3.758 | 3.727 | |
| HDHA | 2 | .675 | .694 | 2677.753 | 2685.522 | 3.420 | 3.403 |
| 8 | .653 | .737 | 2695.145 | 2720.648 | 3.396 | 3.390 | |
[i] Note. All scores are listed to three decimal places to accompany histograms of data.
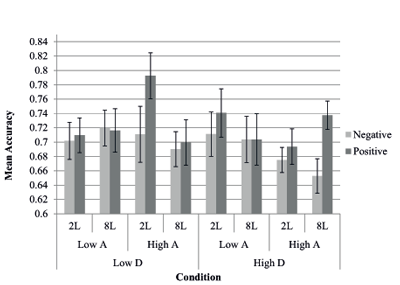
Figure 3
Accuracy data for correctly identifying T2. 2L = lag of two, 8L = lag of eight, A = anxiety, D = depression. Error bars represent standard errors.
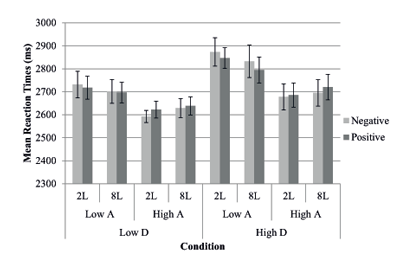
Figure 4
Reaction times for T2 identification. 2L = lag of two, 8L = lag of eight, A = anxiety, D = depression. Error bars represent standard errors.
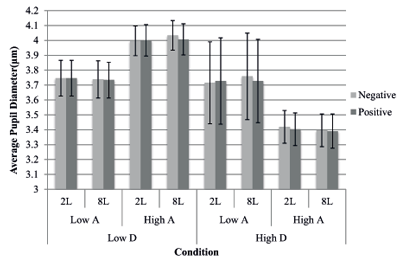
Figure 5
Pupil dilation across trials. 2L = lag of two, 8L = lag of eight, A = anxiety, D = depression. Error bars represent standard errors.