
Figure 1
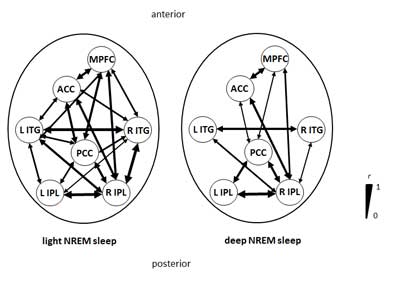
Functional connectivity between DMN regions in deep and light NREM sleep. The right panel shows reduced functional connectivity between DMN subsystems, but not core regions, in deep NREM sleep compared to light sleep. Arrows represent positive correlations between individual DMN regions (circles), line thickness indicates correlation strength. DMN core regions: PCC - posterior cingulate cortex, ACC - anterior cingulate cortex, IPL - inferior parietal lobules (left and right); DMN subsystems: MPFC - medial prefrontal cortex, ITG - inferior temporal gyrus (left and right). Adapted from Koike and colleagues (2011), with the author’s permission.
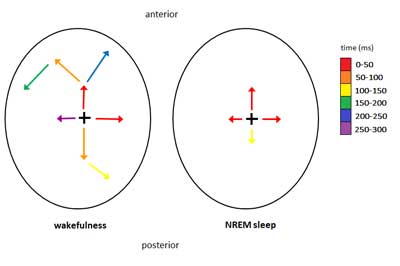
Figure 2
A schematic representation of the spread of activation in the cortex following TMS in NREM sleep and wakefulness. The cross marks the site of TMS application, arrows indicate the spread of activation through the cortex (as measured by EEG, colour-coded by time elapsed from the TMS pulse). While in wakefulness TMS triggers a response of a complex pattern that spreads through a large cortical area, in NREM sleep the TMS-evoked activity only lasts for a short time and does not propagate beyond adjacent cortical areas. Adapted from Massimini and colleagues (2005), with the author’s permission.