
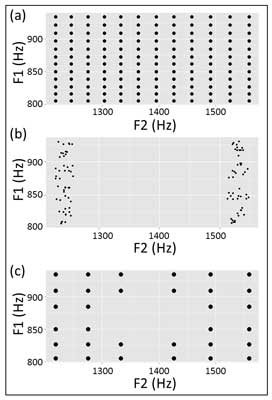
Figure 1
Vowels by first and second formant presented during the post-test (a), the training (b), and the pre-test (c).
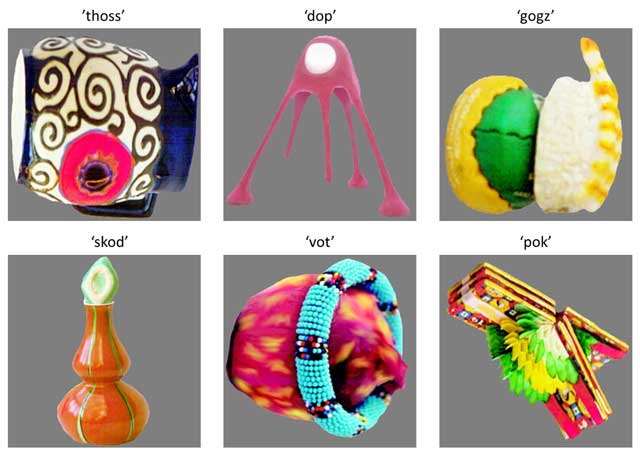
Figure 2
Referent pictures paired with the non-words that were presented during training.
Table 1
Exemplary post-test response pattern.
| Categorization Response | Phonetic Category | |
|---|---|---|
| Low F2 | High F2 | |
| Left | 6 | 105 |
| Right | 138 | 39 |
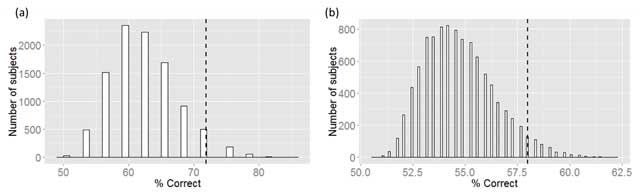
Figure 3
Chance distribution of percentage of correct responses to pre-test (a) and post-test stimuli (b). Dashed lines indicate top 5% threshold.
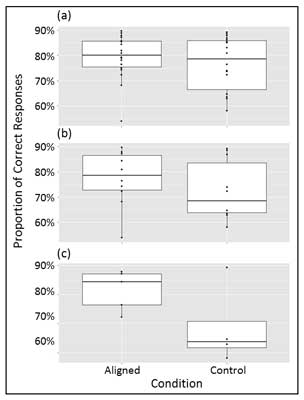
Figure 4
Post-test performance in percentage correct across condition based (a) all subjects (N = 36); (b) subjects that did not use F2 systematically on the pre-test (N = 20); and (c) subjects that performed at chance, but not uniformly, during the pre-test (N = 9).
Table 2
Number of subjects in each condition who performed better than chance in the post-test.
| Difference from Chance | Condition | |
|---|---|---|
| Aligned | Control | |
| Yes | 17 | 17 |
| No | 1 | 1 |
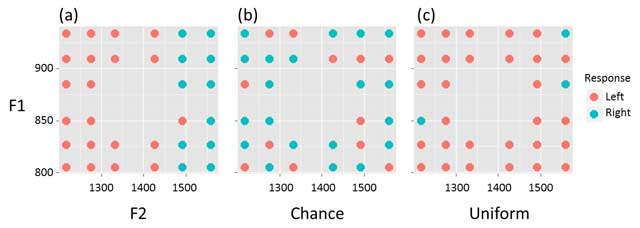
Figure 5
Pre-test response patterns of examplary subjects who were classified as (a) “F2”, (b) “Chance”, or (c) “Uniform”.