
Table 1
Group means, SDs and differences on demographic, behavioral and state variables.
| sugar group | placebo group | ||||
|---|---|---|---|---|---|
| Measure | M | SD | M | SD | d |
| Personal Characteristics | |||||
| Age (years) | 21.80 | 2.22 | 21.79 | 2.94 | 0.00 |
| BMI (kg/m2) | 21.79 | 3.08 | 21.46 | 2.61 | 0.11 |
| Tetris experience | 2.06 | 0.87 | 2.66 | 1.03 | -0.63* |
| State variables | |||||
| Blood glucose (mg/dl) T1 | 99.74 | 33.91 | 98.63 | 16.52 | 0.04 |
| Blood glucose (mg/dl) T2 | 130.11 | 30.55 | 86.40 | 9.67 | 1.93* |
| Pleasantness | 6.31 | 1.80 | 5.80 | 2.59 | 0.23 |
| Hunger | 3.86 | 2.50 | 4.57 | 2.81 | -0.27 |
| Exhaustion | 5.51 | 2.02 | 5.14 | 1.91 | 0.19 |
| Behavioral tasks | |||||
| GNG_false alarms | 6.51 | 4.70 | 8.57 | 6.67 | -0.36 |
| Tetris_% of single-line clears | 54.41 | 16.73 | 54.65 | 20.17 | -0.01 |
| Tetris_% of four-line clears | 6.53 | 12.00 | 5.91 | 11.48 | 0.05 |
| Tetris_total score | 6866.76 | 4355.84 | 7665.20 | 4882.22 | -0.17 |
| Tetris_total number of lines | 35.57 | 16.01 | 35.77 | 16.69 | -0.13 |
| Tetris_number of restarts | 0.63 | 0.65 | 0.66 | 0.59 | -0.05 |
[i] Note. GNG = go/no-go task, d = standardized mean difference experimental group - control group. *p < .05.
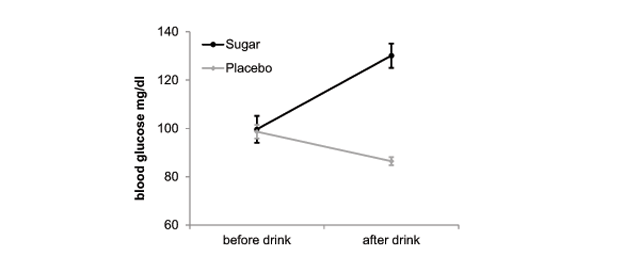
Figure 1
Mean blood glucose levels before and after sugar administration as a function of group assignment. The substantial group difference after drink consumption indicates that the experimental manipulation was successful. Error bars represent standard error of the mean.
Table 2
Intercorrelations of Tetris outcome variables.
| proportion of simple lines | proportion of four-line clears | total score | total number of lines | |
|---|---|---|---|---|
| proportion of four-line clears | -.48** | |||
| total score | -.53** | .35** | ||
| total number of lines | -.53** | .25* | .93** | |
| number of restarts | .30* | -.02 | -.18 | -.25* |
[i] Note. *p < .05, **p < .01.