
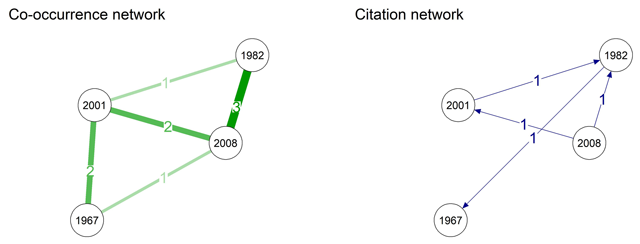
Figure 1
Two different networks. On the left, a co-occurrence network based on the mock data in Table 1 is visualized. On the right, a citation network based on the mock data in Table 1 is visualized.
Table 1
Mock data from five raters who each reported two or three relevant articles in random order. The year uniquely identifies an article. (e.g., the article “1982” is reported by raters 1, 2, and 5).
| Rater | Article 1 | Article 2 | Article 3 |
|---|---|---|---|
| 1 | 1982 | 2008 | |
| 2 | 2001 | 2008 | 1982 |
| 3 | 1967 | 2008 | 2001 |
| 4 | 1967 | 2001 | |
| 5 | 1982 | 2008 |
Table 2
Centrality measures for the co-occurrence network on the mock data.
| Article | Betweenness | Closeness | Strength |
|---|---|---|---|
| 1967 | –.072 | –1.08 | –1.16 |
| 1982 | –0.72 | –0.61 | –0.38 |
| 2001 | 0.06 | 0.84 | 0.38 |
| 2008 | 1.39 | 0.84 | 1.16 |
Table 3
Centrality measures for the citation network on the mock data.
| Article | Betweenness | In-degree | Out-degree |
|---|---|---|---|
| 1967 | –0.5 | 0 | –1.22 |
| 1982 | 1.5 | 1.22 | 0 |
| 2001 | –0.5 | 0 | 0 |
| 2008 | –0.5 | –1.22 | 1.22 |
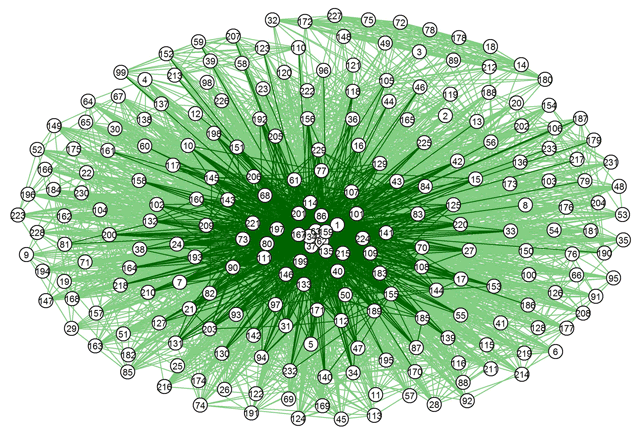
Figure 2
The co-occurrence network applied to the search process for the ANCOVA-pitfall literature before 2001. Each node represents a reported article. Undirected edges represent the number of times the two articles were reported by the same rater. Thicker and saturated edges represent stronger connections.
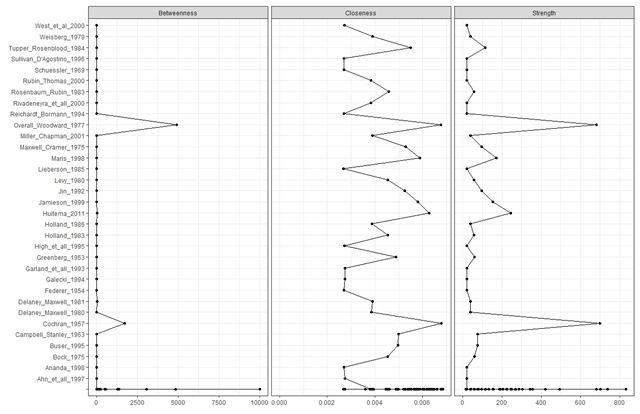
Figure 3
Centrality plot containing all centrality indices for the single nodes of the co-occurrence network. For readability, only 44 of the 244 articles are shown.
Table 5
Kendall correlations and 95% credible intervals for the correlations between the mean relevance grades and centrality measures of the articles used in the co-occurrence network.
| τ | 95% credible interval | |
|---|---|---|
| Relevance grade — Betweenness | 0.255 | [0.164, 0.337] |
| Relevance grade — Closeness | 0.224 | [0.134, 0.307] |
| Relevance grade — Strength | 0.258 | [0.166, 0.341] |
Table 6
Top ten articles in the entire search before 2001. The ranks are the final network ranks obtained from the co-occurrence network.
| Article | Title | Rank |
|---|---|---|
| Evans & Anastasio (1968) | Misuse of analysis of covariance when treatment effect and covariate are confounded. | 1 |
| Lord (1967) | A paradox in the interpretation of group comparisons. | 2 |
| Overall & Woodward (1977) | Nonrandom assignment and the analysis of covariance. | 3 |
| Cochran (1957) | Analysis of covariance: Its nature and uses. | 4 |
| Elashoff (1969) | Analysis of covariance: A delicate instrument. | 5 |
| Porter & Raudenbush (1987) | Analysis of covariance: Its model and use in psychological research. | 6 |
| Adams et al. (1985) | Analysis of covariance as a remedy for demographic mismatch of research subject groups: Some sobering simulations. | 7 |
| Lord (1969) | Statistical adjustments when comparing preexisting groups. | 8 |
| Wainer (1991) | Adjusting for differential base rates: Lord’s paradox again. | 9 |
| Keselman et al. (1998) | Statistical practices of educational researchers: An analysis of their ANOVA, MANOVA, and ANCOVA analysis. | 10 |
Table 7
Kendall correlations and 95% credible intervals computed between the final rank based on the co-occurrence network and ranks based on mean relevance grade and number of raters.
| τ | 95% credible interval | |
|---|---|---|
| A: Rank by number of raters — Final rank | 0.789 | [0.687, 0.858] |
| B: Rank by relevance grade — Final rank | 0.241 | [0.150, 0.325] |
| Rank by average of A and B — Final rank | 0.554 | [0.459, 0.631] |
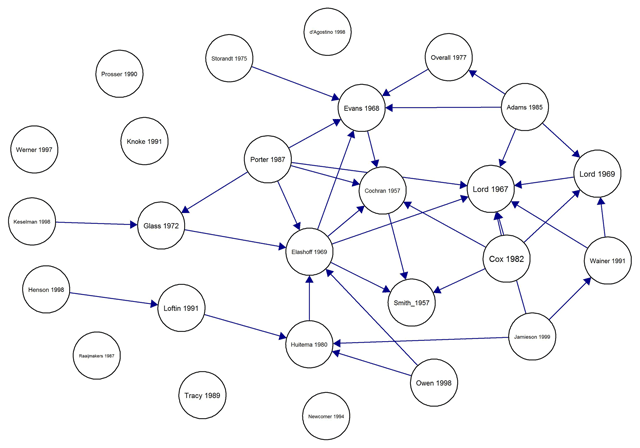
Figure 4
The citation network applied to the search process for the ANCOVA-pitfall literature before 2001. Each node represents a reported article. Directed edges represent whether or not an article cited another article. Connected nodes represent a source-target relation. The source is the paper that cites the target, for example the arrow from Cox (1982) to Lord (1967) means that Cox cited Lord.
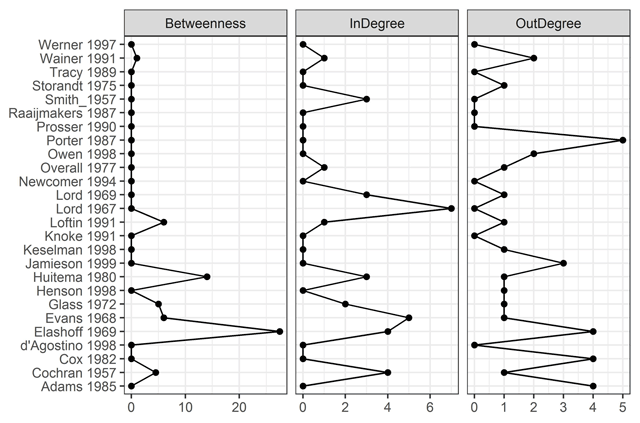
Figure 5
Centrality plot containing all centrality indices for the single nodes. Note that closeness requires a fully connected network and is therefore omitted.
Table 8
Kendall correlations and 95% credible intervals computed between the mean relevance grades and centrality measures of the articles used in the citation network.
| τ | 95% credible interval | |
|---|---|---|
| Relevance grade — Betweenness | –0.090 | [–0.333, 0.168] |
| Relevance grade — In-degree | 0.012 | [–0.240, 0.261] |
| Relevance grade — Out-degree | –0.192 | [–0.423, 0.078] |
Table 9
Top ten articles in the entire search before 2001. The ranks are the final network ranks obtained from the citation network.
| Article | Title | Rank |
|---|---|---|
| Elashoff (1969) | Analysis of covariance: A delicate instrument. | 1 |
| Huitema (1980) | The analysis of covariance and alternatives. | 2 |
| Evans & Anastasio (1968) | Misuse of analysis of covariance when treatment effect and covariate are confounded. | 3 |
| Loftin (1990) | The extreme dangers of covariance corrections. | 4 |
| Wainer (1991) | Adjusting for differential base rates: Lord’s paradox again. | 5 |
| Cochran (1957) | Analysis of covariance: Its nature and uses. | 6 |
| Glass et al. (1972) | Consequences of failure to meet assumptions underlying the fixed effects analyses of variance and covariance. | 7 |
| Porter & Raudenbush (1987) | Analysis of covariance: Its model and use in psychological research. | 8 |
| Cox & McCullagh (1982) | Some aspects of analysis of covariance. | 9 |
| Adams et al. (1985) | Analysis of covariance as a remedy for demographic mismatch of research subject groups: Some sobering simulations. | 10 |
Table 10
Kendall correlations and 95% credible intervals computed between the final rank based on the citation network and ranks based on mean relevance grade and number of raters.
| τ | 95% credible interval | |
|---|---|---|
| A: Rank by number of raters — Final rank | –0.032 | [–0.281, 0.220] |
| B: Rank by relevance grade — Final rank | 0.126 | [–0.138, 0.363] |
| Rank by average of A and B — Final rank | 0.077 | [–0.182, 0.319] |
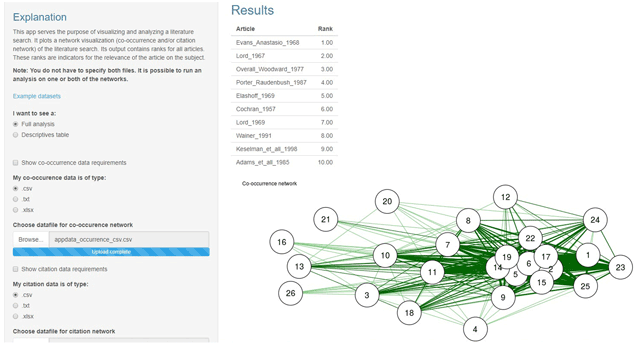
Figure 6
Screenshot of the Literature Networks web application showing a co-occurrence network with a corresponding top 10 list of most relevant articles. See online Appendix C (osf.io/bxz6c/) for a manual and walkthrough of the application.