
Table 1
Climatic conditions for the location where the study was carried out [64].
| Month | Hours of sunshine (h) | Global radiation (kWh/m2) | Days with rainfall/snowfall (number of days) | Mean air temperature (°C) |
|---|---|---|---|---|
| February | 69 | 29.9 | 10 | 4.1 |
| March | 140 | 71.6 | 19 | 3.4 |
| April | 219 | 128.9 | 8 | 7.9 |
| May | 364 | 202.6 | 4 | 12.8 |
| June | 289 | 188.3 | 11 | 16.0 |
| July | 312 | 189.8 | 7 | 18.8 |
| August | 168 | 114 | 20 | 17.3 |
| September | 159 | 88.4 | 11 | 13.3 |
| October | 112 | 47.3 | 22 | 9.4 |
| November | 40 | 14.8 | 20 | 5.5 |
| December | 28 | 8.8 | 16 | 2.1 |
| January | 39 | 12.1 | 14 | 0.0 |
Table 2
Mean ambient room temperature across the year. Measurements were conducted with a calibrated Testo 720 digital temperature meter (Testo Se&Co. KGaA, Lenzkirch, Germany) in the morning and afternoon at five times (in February/March, in April/May, in June/July, in September/October, and in December/January).
| Parameter | Feb/Mar | Apr/May | Jun/Jul | Sep/Oct | Dec/Jan | |
|---|---|---|---|---|---|---|
| Room temperature | Mean (°C) | 22.7 | 22.7 | 22.7 | 21.7 | 22.1 |
| N = 30 | SD (°C) | 1.0 | 0.7 | 0.9 | 0.7 | 0.7 |
Table 3
An example for PANAS when missing values have been replaced by means.
| Day 1 | Day 2 | Day 3 | Day 4 | ||||||||||
|---|---|---|---|---|---|---|---|---|---|---|---|---|---|
| Parameter | 12.00 | 15.00 | 20.00 | 08.00 | 12.00 | 15.00 | 20.00 | 08.00 | 12.00 | 15.00 | 20.00 | 08.00 | 12.00 |
| PA | 28 | 27 | 23 | 35 | 40 | 31.6 | 26.9 | 38 | 39 | 31 | 24 | 32 | 28 |
| NA | 17 | 24 | 21 | 16 | 23 | 15.6 | 13.9 | 16 | 14 | 18 | 15 | 19 | 14 |
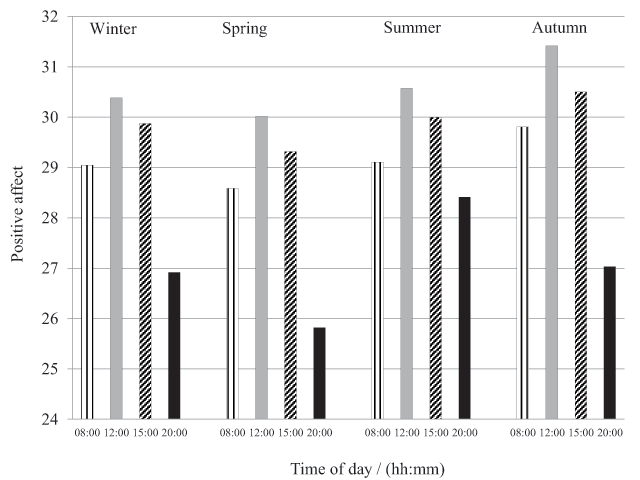
Figure 1
Diurnal and seasonal variation in Positive affect (N = 30).
Table 4
Mean, median and standard deviation for ratings of positive affect (PA) at the different times of the day and daily average across the seasons.
| 08:00 | 12:00 | 15:00 | 20:00 | |||
|---|---|---|---|---|---|---|
| Winter | Mean | 28.55 | 28.42 | 29.72 | 29.25 | 26.39 |
| N = 30 | Median | 28.90 | 28.78 | 29.67 | 29.67 | 27.48 |
| SD | 6.94 | 7.60 | 7.59 | 7.17 | 6.18 | |
| Spring | Mean | 27.49 | 27.65 | 29.12 | 28.50 | 24.85 |
| N = 30 | Median | 26.67 | 27.89 | 28.98 | 28.89 | 25.76 |
| SD | 6.24 | 6.68 | 6.98 | 6.74 | 6.36 | |
| Summer | Mean | 28.97 | 28.51 | 29.90 | 29.36 | 27.82 |
| N = 30 | Median | 30.05 | 29.83 | 30.63 | 30.44 | 28.79 |
| SD | 7.18 | 7.65 | 7.78 | 7.72 | 6.52 | |
| Autumn | Mean | 29.18 | 29.15 | 30.71 | 29.84 | 26.54 |
| N = 30 | Median | 30.56 | 29.50 | 31.70 | 30.94 | 27.60 |
| SD | 7.40 | 7.71 | 8.25 | 8.14 | 6.41 |
Table 5
Mean, median and standard deviation for ratings of negative affect (NA) at the different times of the day and daily average across the seasons.
| 08:00 | 12:00 | 15:00 | 20:00 | |||
|---|---|---|---|---|---|---|
| Winter | Mean | 13.03 | 12.85 | 13.17 | 13.17 | 12.95 |
| N = 30 | Median | 10.98 | 11.07 | 10.97 | 10.97 | 11.12 |
| SD | 3.84 | 3.97 | 4.02 | 4.02 | 3.55 | |
| Spring | Mean | 12.99 | 12.84 | 12.99 | 12.99 | 13.15 |
| N = 30 | Median | 12.13 | 11.78 | 11.75 | 11.75 | 12.11 |
| SD | 2.90 | 2.94 | 2.96 | 2.96 | 3.01 | |
| Summer | Mean | 12.81 | 12.95 | 12.79 | 12.79 | 12.72 |
| N = 30 | Median | 10.82 | 11.05 | 10.62 | 10.62 | 10.58 |
| SD | 3.50 | 3.66 | 3.50 | 3.50 | 3.60 | |
| Autumn | Mean | 12.64 | 12.68 | 12.57 | 12.57 | 12.72 |
| N = 30 | Median | 11.64 | 11.5 | 11.36 | 11.36 | 12.17 |
| SD | 3.13 | 3.16 | 3.20 | 3.20 | 3.14 |
Table 6
Mean, median and standard deviation for wake-up time, bed time and sleep duration across the seasons.
| Season | Wake-up time (hh:min) | Sleep time (hh:mm) | Sleep duration (hh:mm) | |
|---|---|---|---|---|
| Winter | Mean | 06:17 | 22:50 | 07:27 |
| N = 30 | Median | 06:17 | 23:03 | 07:15 |
| SD | 00:35 | 00:38 | 00:48 | |
| Spring | Mean | 06:09 | 22:48 | 07:27 |
| N = 30 | Median | 06:11 | 23:01 | 07:12 |
| SD | 00:23 | 00:43 | 00:42 | |
| Summer | Mean | 06:12 | 23:05 | 07:07 |
| N = 30 | Median | 06:15 | 23:04 | 07:10 |
| SD | 00:20 | 00:27 | 00:27 | |
| Autumn | Mean | 06:13 | 22:56 | 07:16 |
| N = 30 | Median | 06:17 | 23:03 | 07:15 |
| SD | 00:27 | 00:42 | 00:40 |
Table 7
Mean, median and standard deviation for assessments of lighting conditions in the offices in the morning and afternoon in February (Feb), April (Apr), June (Jun), September (Sep) and December (Dec).
| Parameter | Morning | Afternoon | |||||||||
|---|---|---|---|---|---|---|---|---|---|---|---|
| Feb | Apr | Jun | Sep | Dec | Feb | Apr | Jun | Sep | Dec | ||
| Hedonic tone | Mean | 4.86 | 4.95 | 4.81 | 5.15 | 4.80 | 4.86 | 4.99 | 4.88 | 5.04 | 4.73 |
| N = 30 | Median | 4.83 | 5.00 | 4.83 | 5.17 | 4.69 | 4.77 | 5.00 | 5.00 | 5.06 | 4.83 |
| SD | 0.84 | 0.80 | 0.82 | 0.78 | 0.81 | 0.82 | 0.75 | 0.87 | 0.92 | 1.05 | |
| Strength | Mean | 4.70 | 5.02 | 4.74 | 4.75 | 4.61 | 4.80 | 4.95 | 4.78 | 4.80 | 4.63 |
| N = 30 | Median | 5.00 | 5.00 | 4.75 | 4.84 | 4.69 | 4.75 | 5.00 | 4.75 | 4.63 | 4.75 |
| SD | 1.01 | 0.52 | 0.96 | 0.63 | 0.98 | 0.90 | 0.77 | 1.01 | 0.96 | 1.00 | |
| Variation | Mean | 3.62 | 3.94 | 3.95 | 3.93 | 4.00 | 3.82 | 3.95 | 3.95 | 3.90 | 4.13 |
| N = 30 | Median | 3.75 | 4.00 | 4.00 | 3.77 | 4.00 | 3.81 | 4.00 | 4.00 | 3.77 | 4.06 |
| SD | 0.56 | 0.71 | 0.64 | 0.75 | 0.73 | 0.58 | 0.66 | 0.69 | 0.58 | 0.75 | |
| Flicker | Mean | 1.92 | 2.04 | 2.41 | 1.92 | 2.26 | 2.12 | 2.18 | 2.34 | 2.14 | 2.15 |
| N = 30 | Median | 1.00 | 1.00 | 2.00 | 1.00 | 1.50 | 2.00 | 2.00 | 2.00 | 1.50 | 1.50 |
| SD | 1.34 | 1.58 | 1.77 | 1.39 | 1.57 | 1.50 | 1.54 | 1.74 | 1.63 | 1.56 | |
| Visibility | Mean | 5.79 | 5.63 | 5.67 | 5.71 | 5.49 | 5.30 | 5.28 | 5.53 | 5.38 | 5.32 |
| N = 30 | Median | 6.00 | 6.00 | 6.00 | 6.00 | 6.00 | 6.00 | 6.00 | 6.00 | 6.00 | 6.00 |
| SD | 1.46 | 1.53 | 1.20 | 1.20 | 1.40 | 1.56 | 1.84 | 1.46 | 1.55 | 1.55 | |
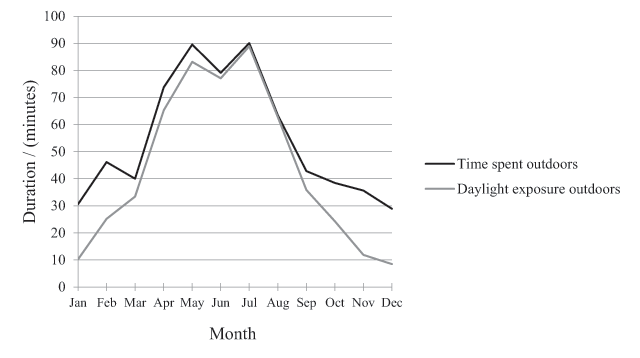
Figure 2
Time spent outdoors and in bright daylight outdoors during the year (N = 30).
Table 8
Mean, median and standard deviation for time (minutes) spent outdoors during the different periods of the day across the year.
| 04:00–08:00 | 08:00–12:00 | 12:00–16:00 | 16:00–20:00 | 20:00–24:00 | 00:00–04:00 | |||
|---|---|---|---|---|---|---|---|---|
| Winter | Mean | 6.5 | 2.5 | 7.2 | 13.3 | 2.3 | 0 | 31.8 |
| N = 30 | Median | 1.6 | 0 | 6.5 | 12.2 | 0 | 0 | 31.4 |
| SD | 8.0 | 3.7 | 7.7 | 11.2 | 4.1 | 0 | 26.4 | |
| Spring | Mean | 8.5 | 3.8 | 10.6 | 23.6 | 4.6 | 0.5 | 51.7 |
| N = 30 | Median | 7.5 | 2.5 | 9.7 | 20.0 | 3.1 | 0 | 49.6 |
| SD | 7.7 | 4.0 | 8.8 | 15.8 | 5.4 | 2.8 | 31.7 | |
| Summer | Mean | 6.8 | 3.8 | 12.8 | 43.3 | 15.1 | 0.7 | 85.1 |
| N = 30 | Median | 3.8 | 1.7 | 12.5 | 42.2 | 13.3 | 0.0 | 81.9 |
| SD | 7.4 | 6.3 | 11.8 | 30.0 | 12.1 | 3.6 | 50.6 | |
| Autumn | Mean | 6.1 | 2.1 | 9.2 | 23.7 | 5.5 | 0 | 46.6 |
| N = 30 | Median | 3.7 | 1.3 | 7.9 | 17.2 | 1.5 | 0 | 42.3 |
| SD | 6.8 | 3.1 | 7.5 | 22.1 | 6.7 | 0.2 | 35.1 |
Table 9
Mean, median and standard deviation for exposure (minutes) to bright daylight outdoors during the different periods of the day across the year.
| 04:00–08:00 | 08:00–12:00 | 12:00–16:00 | 16:00–20:00 | 20:00–24:00 | 00:00–04:00 | |||
|---|---|---|---|---|---|---|---|---|
| Winter | Mean | 0.8 | 2.1 | 7.1 | 0.2 | 0 | 0 | 10.2 |
| N = 30 | Median | 0 | 0.3 | 6.5 | 0 | 0 | 0 | 8.3 |
| SD | 1.5 | 3.1 | 7.6 | 0.6 | 0 | 0 | 10.1 | |
| Spring | Mean | 7.3 | 4.1 | 10.6 | 19.0 | 0.4 | 0 | 41.4 |
| N = 30 | Median | 5.4 | 2.5 | 10.6 | 16.9 | 0 | 0 | 39.1 |
| SD | 7.0 | 4.4 | 8.9 | 13.2 | 1.0 | 0 | 24.8 | |
| Summer | Mean | 8.3 | 4.0 | 13.2 | 45.1 | 12.5 | 0 | 83.1 |
| N = 30 | Median | 5.0 | 1.7 | 12.8 | 43.9 | 12.4 | 0 | 80.6 |
| SD | 9.0 | 6.3 | 11.8 | 29.2 | 9.7 | 0 | 47.0 | |
| Autumn | Mean | 5.8 | 2.1 | 9.6 | 22.3 | 1.2 | 0 | 40.9 |
| N = 30 | Median | 4.4 | 1.3 | 7.9 | 17.3 | 0 | 0 | 35.5 |
| SD | 5.9 | 3.2 | 7.8 | 20.3 | 2.9 | 0 | 31.4 |
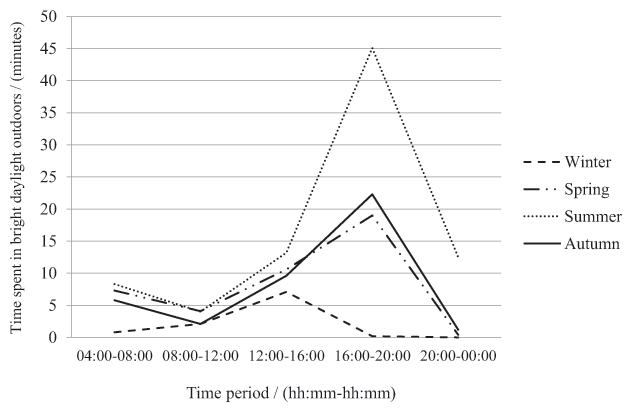
Figure 3
Time spent in bright daylight outdoors during the different time periods of the day across the year (N = 30).
Table 10
Time of sunrise and sunset, work schedules, sleep-wake behavior and daylight availability during leisure time (N = 30).
| Month | Sunrise (hh:mm) | Sunset (hh:mm) | Start work (hh:mm) | End work (hh:mm) | Wake up time (hh:mm) | Bedtime (hh:mm) | Time in bed (hh:mm) | Start work-Sunrise (hh:mm) | End work-Sunset (hh:mm) | Daylight hours during leisure time (hh:mm) |
|---|---|---|---|---|---|---|---|---|---|---|
| Jun | 04:24 | 20:58 | 07:48 | 16:24 | 06:08 | 23:03 | 07:06 | 03:24 | 04:34 | 07:58 |
| Jul | 04:46 | 20:45 | 07:50 | 16:19 | 06:14 | 23:11 | 07:04 | 03:04 | 04:26 | 07:30 |
| Aug | 05:41 | 19:46 | 07:51 | 15:55 | 06:11 | 22:57 | 07:14 | 02:10 | 03:51 | 06:01 |
| Sep | 06:41 | 18:26 | 07:48 | 16:40 | 06:14 | 23:00 | 07:18 | 01:07 | 01:46 | 02:53 |
| Oct | 07:36 | 17:08 | 07:48 | 16:28 | 06:14 | 22:55 | 07:18 | 00:12 | 00:40 | 00:52 |
| Nov | 07:46 | 16:01 | 07:59 | 16:23 | 06:17 | 22:45 | 07:30 | 00:13 | 00:00 | 00:13 |
| Dec | 08:33 | 15:34 | 07:57 | 16:32 | 06:15 | 22:52 | 07:21 | 00:00 | 00:00 | 00:00 |
| Jan | 08:28 | 16:06 | 07:50 | 16:49 | 06:18 | 22:50 | 07:27 | 00:00 | 00:00 | 00:00 |
| Feb | 07:36 | 17:11 | 07:45 | 16:54 | 06:06 | 22:49 | 07:13 | 00:09 | 00:17 | 00:26 |
| Mar | 06:28 | 18:13 | 07:50 | 16:53 | 06:06 | 22:39 | 07:26 | 01:22 | 01:20 | 02:42 |
| Apr | 06:03 | 19:17 | 07:54 | 16:28 | 06:15 | 22:53 | 07:21 | 01:51 | 02:49 | 04:40 |
| May | 04:56 | 20:17 | 07:52 | 16:27 | 06:14 | 23:00 | 07:13 | 02:56 | 03:50 | 06:46 |