
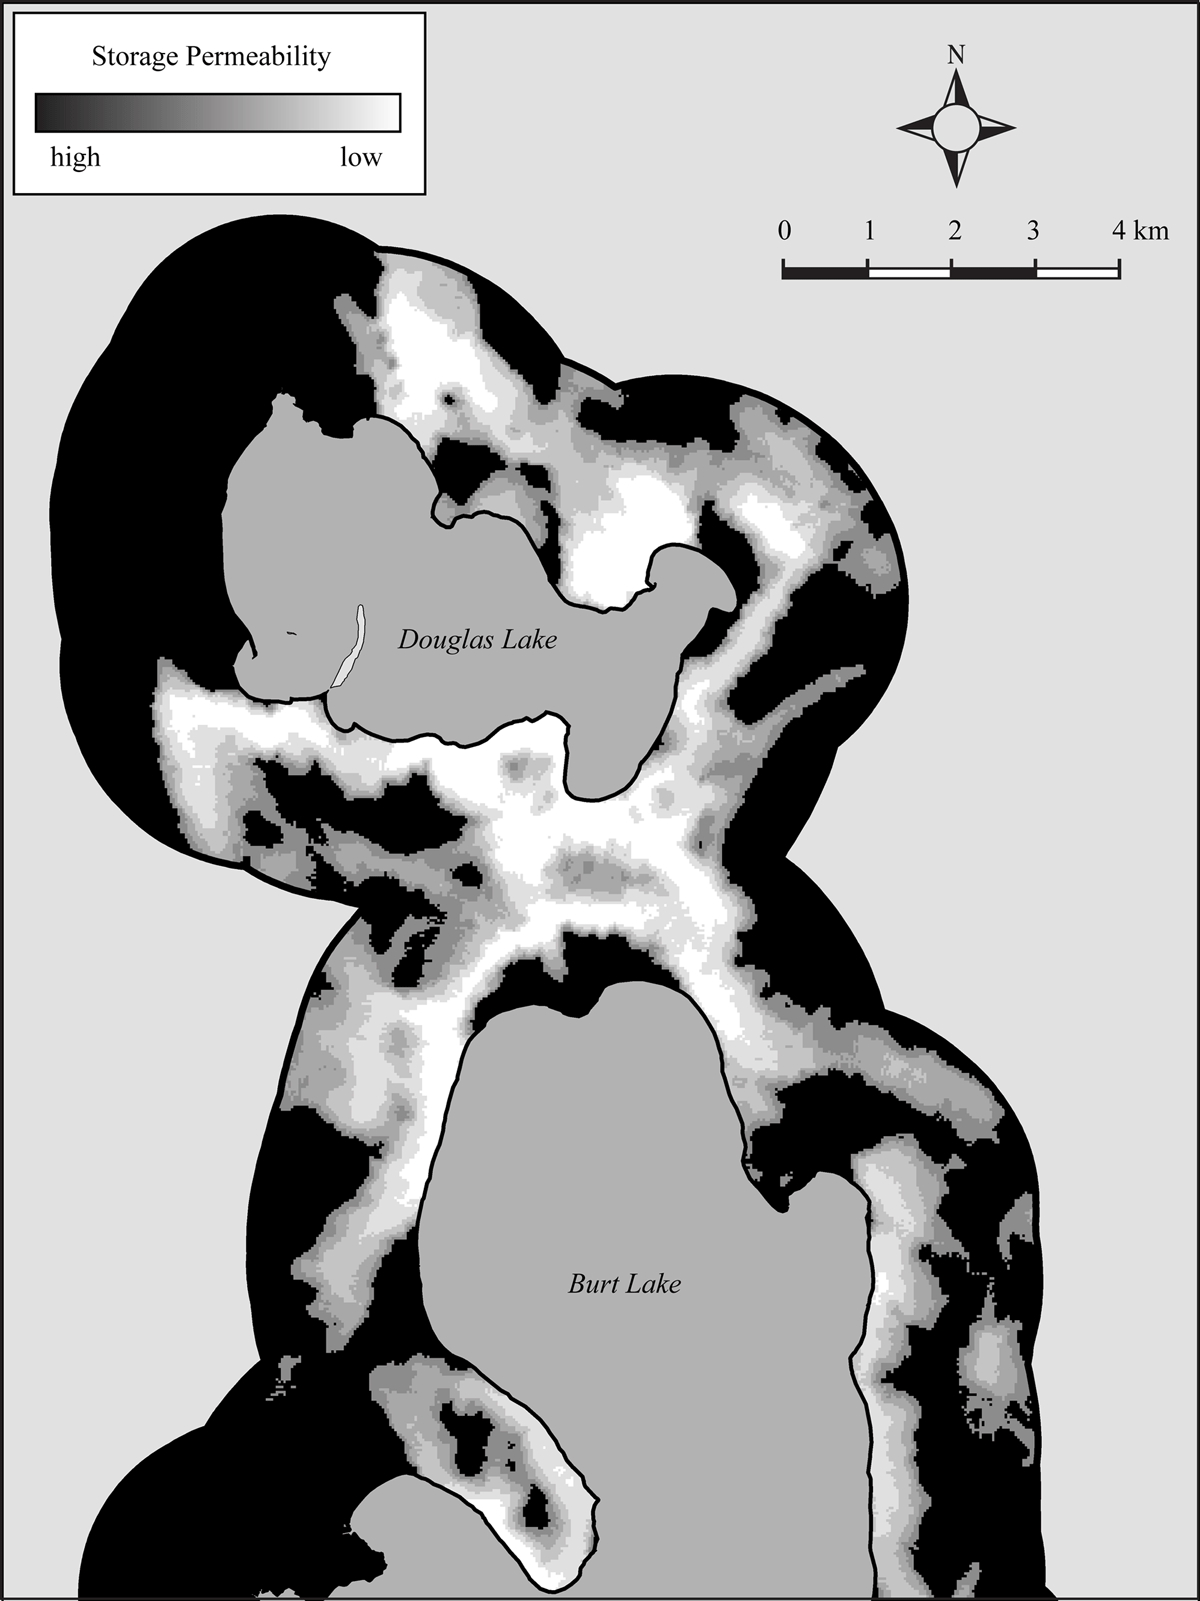
Figure 1
Storage Permeability Grid Depicting Low to High Suitability for Storage (from Howey 2015: Figure 6).
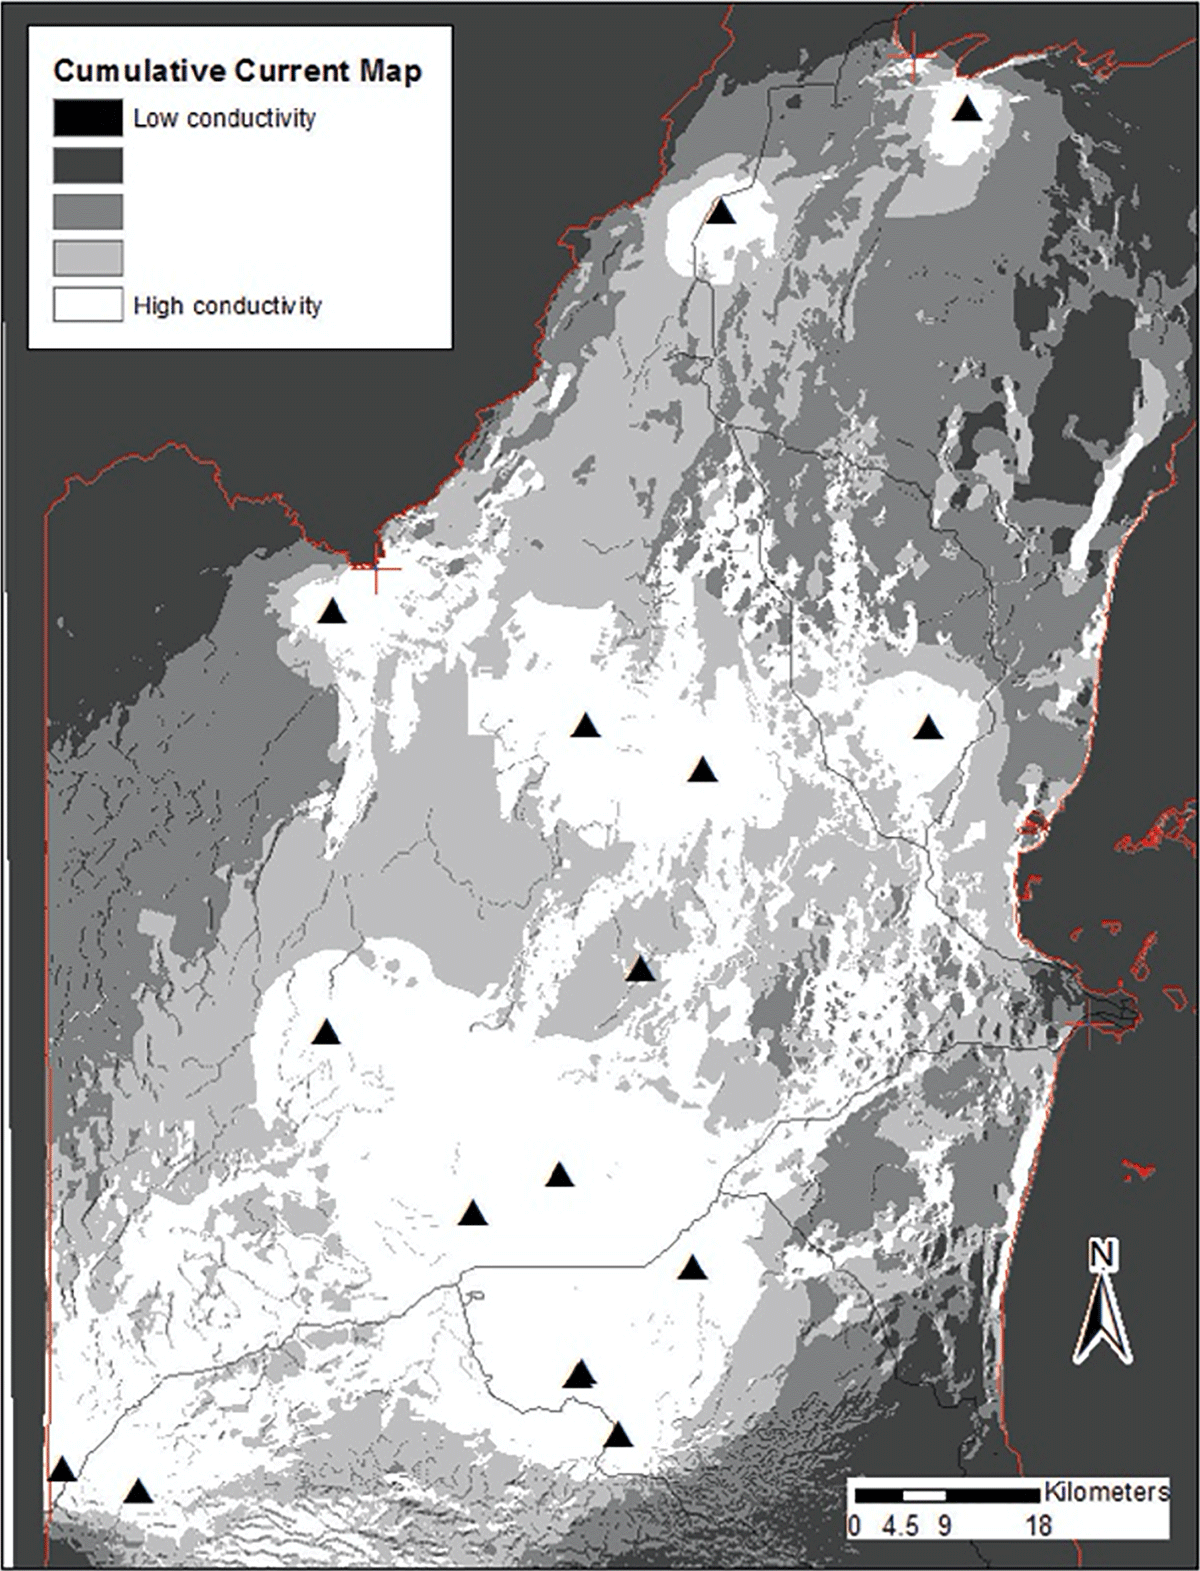
Figure 2
Circuitscape Modeling Results Depicting Cumulative Current Map for Linking Contact Periods Sites in Central and Northern Belize (from Brouwer Burg et al. 2014: Figure 9a).
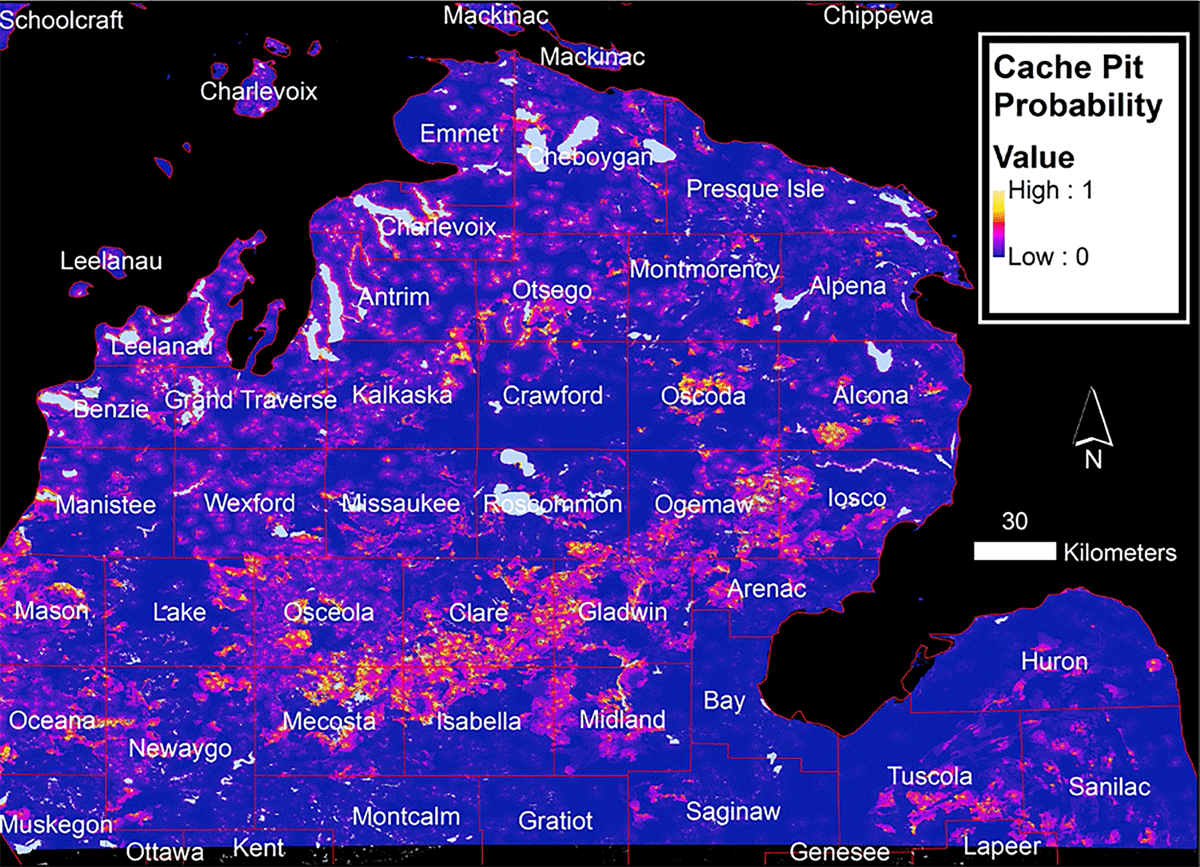
Figure 3
Results of Maximum Entropy Analysis of Cache Pit Probability in Northern Michigan (from Howey et al. 2020: Figure 4).
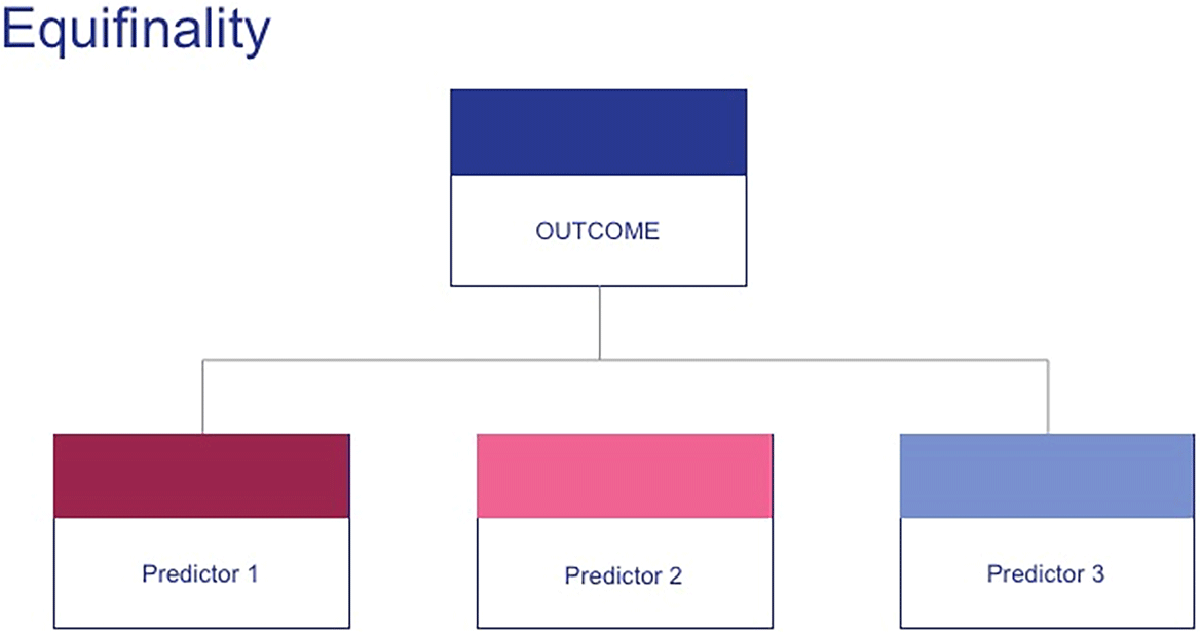
Figure 4
The Challenge of Equifinality in Parsing Archaeological Diversity Measures.
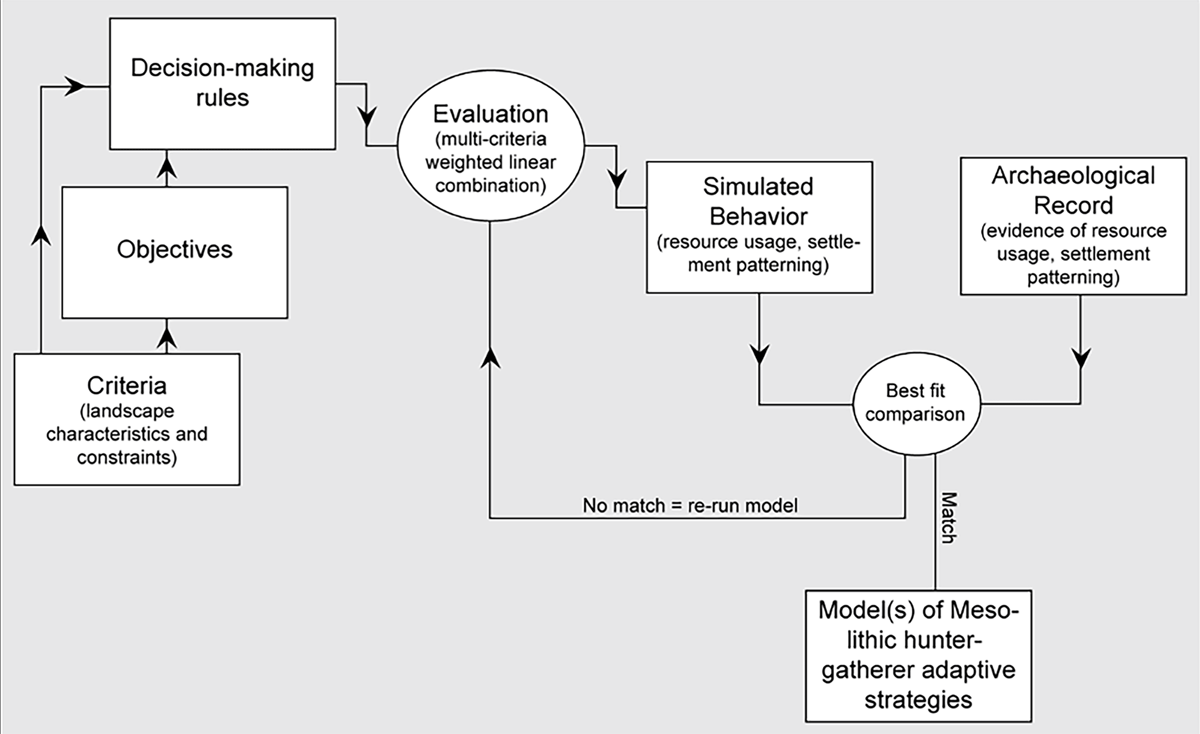
Figure 5
Decision Tree Used to Predict Hypothesized Hunter-Gatherer Behavior in the Dutch Mesolithic (from Brouwer 2011: Figure 5.1).
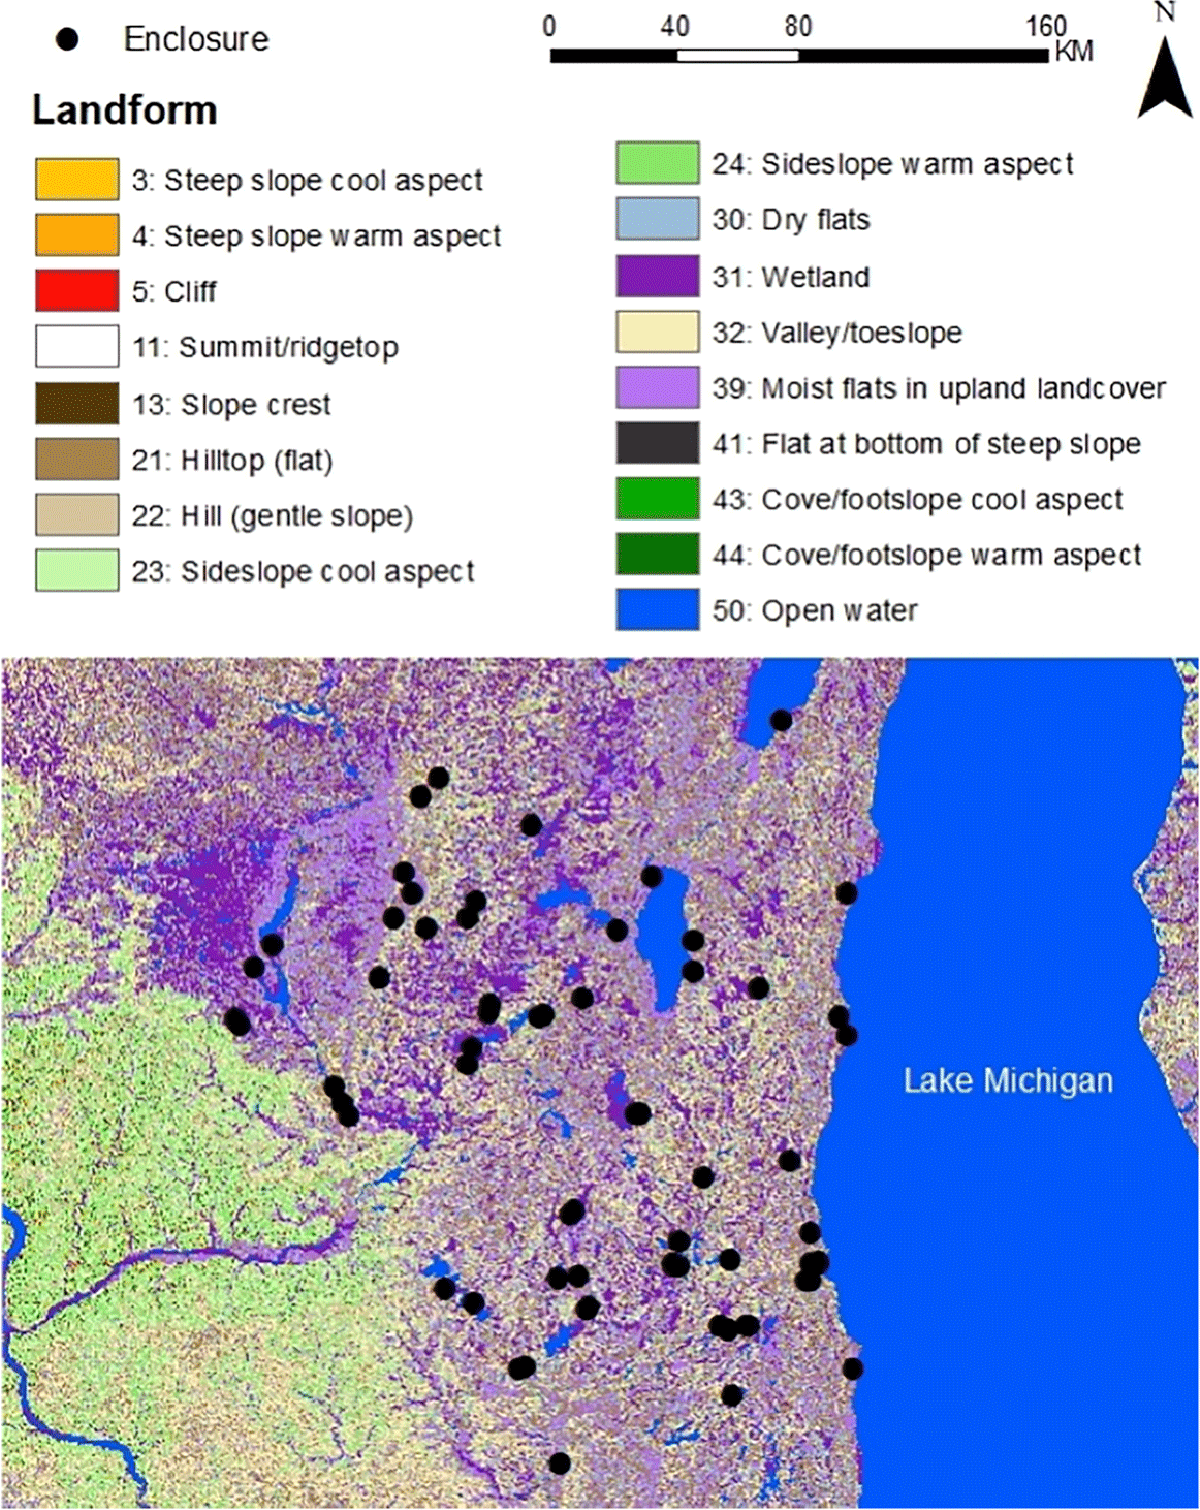
Figure 6
Potential Late Precontact Enclosures in Wisconsin (Brouwer Burg and Howey 2019).