

Figure 1
Study area, including the archaeological sites and its boundary using Google Earth imagery: (a) a map of Egypt, (b) a map of the study area with about 500 archaeological sites.

Figure 2
Deterioration of some archaeological building walls in Historic Cairo city due to salinization and cracking processes; (a) Link between the changes in land subsidence values on the groundwater level east of Lancaster area (After [31]), (b) Effect of land subsidence on the walls of ElSaleh Negmeldin Dome, (c) Effect of land subsidence on the walls of the Zoelfakar bek mosque, (d) Effect of high levels of groundwater on the walls of the Al Nasir Mohammed Ibn Qalawun complex, (e) Effect of high levels of groundwater on the walls of the Sultan Al-ashraf Barsbay mosque.
Table 1
Raw data includes optical and radar satellite imagery properties.
| DATA | SENSOR | RESOLUTION/M | ACQUISITION DATE | SOURCE |
|---|---|---|---|---|
| Optical Data | Corona J-1 (KH-4A) | 2.75 | 25th January 1965 | USGS (Earth Explorer) |
| Orbview-3 | 01 | 20th January 2004 | ||
| Landsat 8 OLI (Band 10) | 100 100 | Jan-Dec 2013 Jan-Dec 2022 | ||
| Radar data | SRTM (1-ARC Second Global) | 30 | 23rd September 2014 | USGS (Earth Explorer) |
| Sentinel-1 SLC | 2.7 × 22 to 3.5 × 22 | 15th Dec 2016 30th July 2016 30th June 2024 09th Nov 2024 | ESA (data scientific hub) | |
| Sentinel-1 GRD | 20 × 22 | 15th–21st October 2019 |

Figure 3
The flowchart of the study includes the data, methods, results, and recommendations.
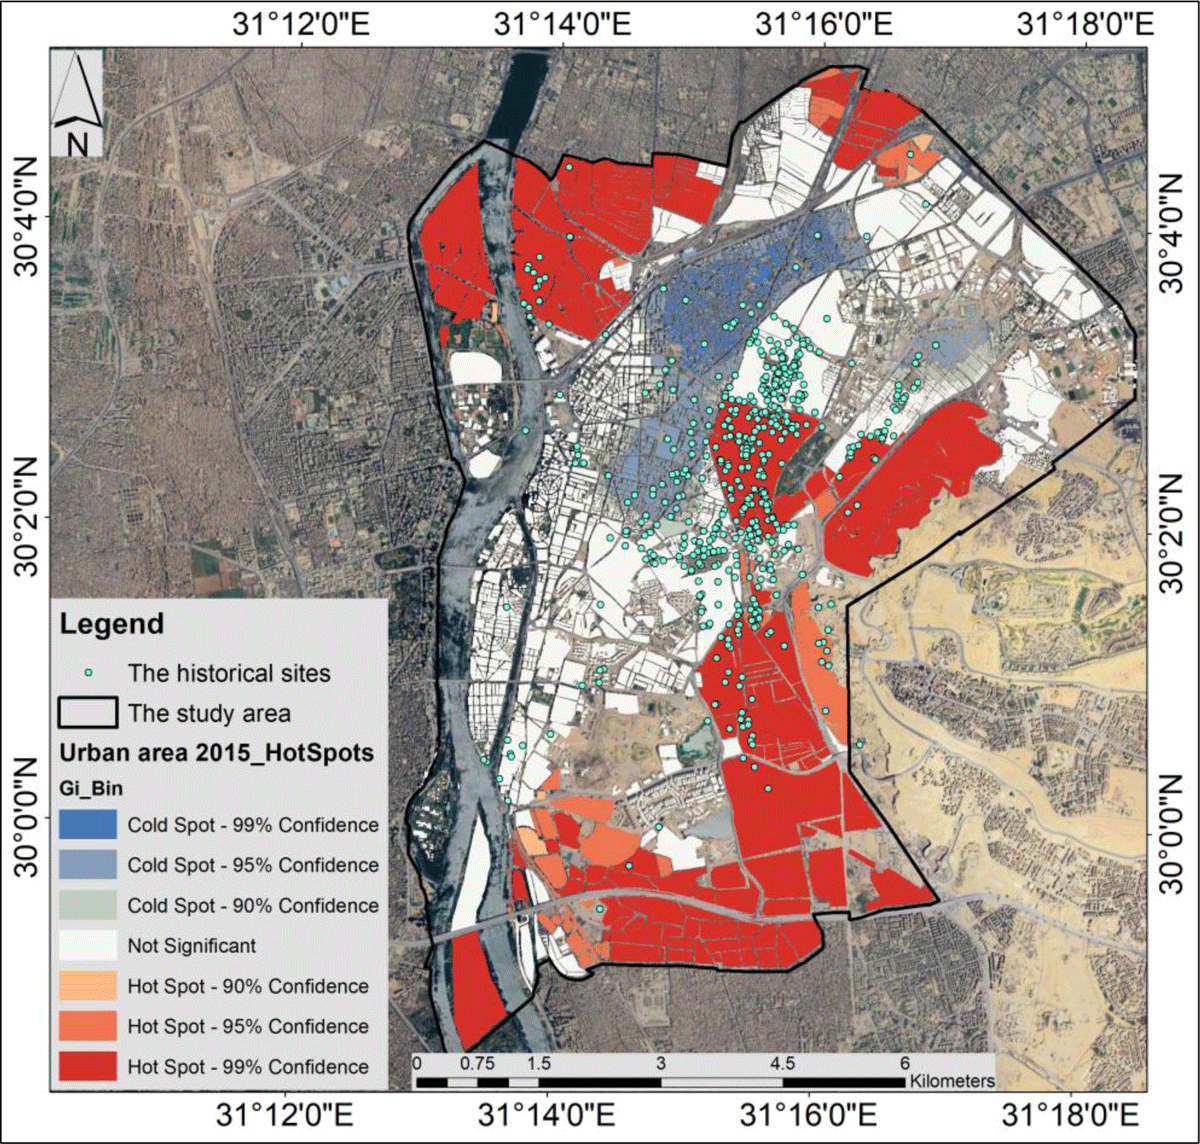
Figure 4
Urban hot spot areas in 2015 showing the heritage sites in the cold, not significant, and hot spot areas.
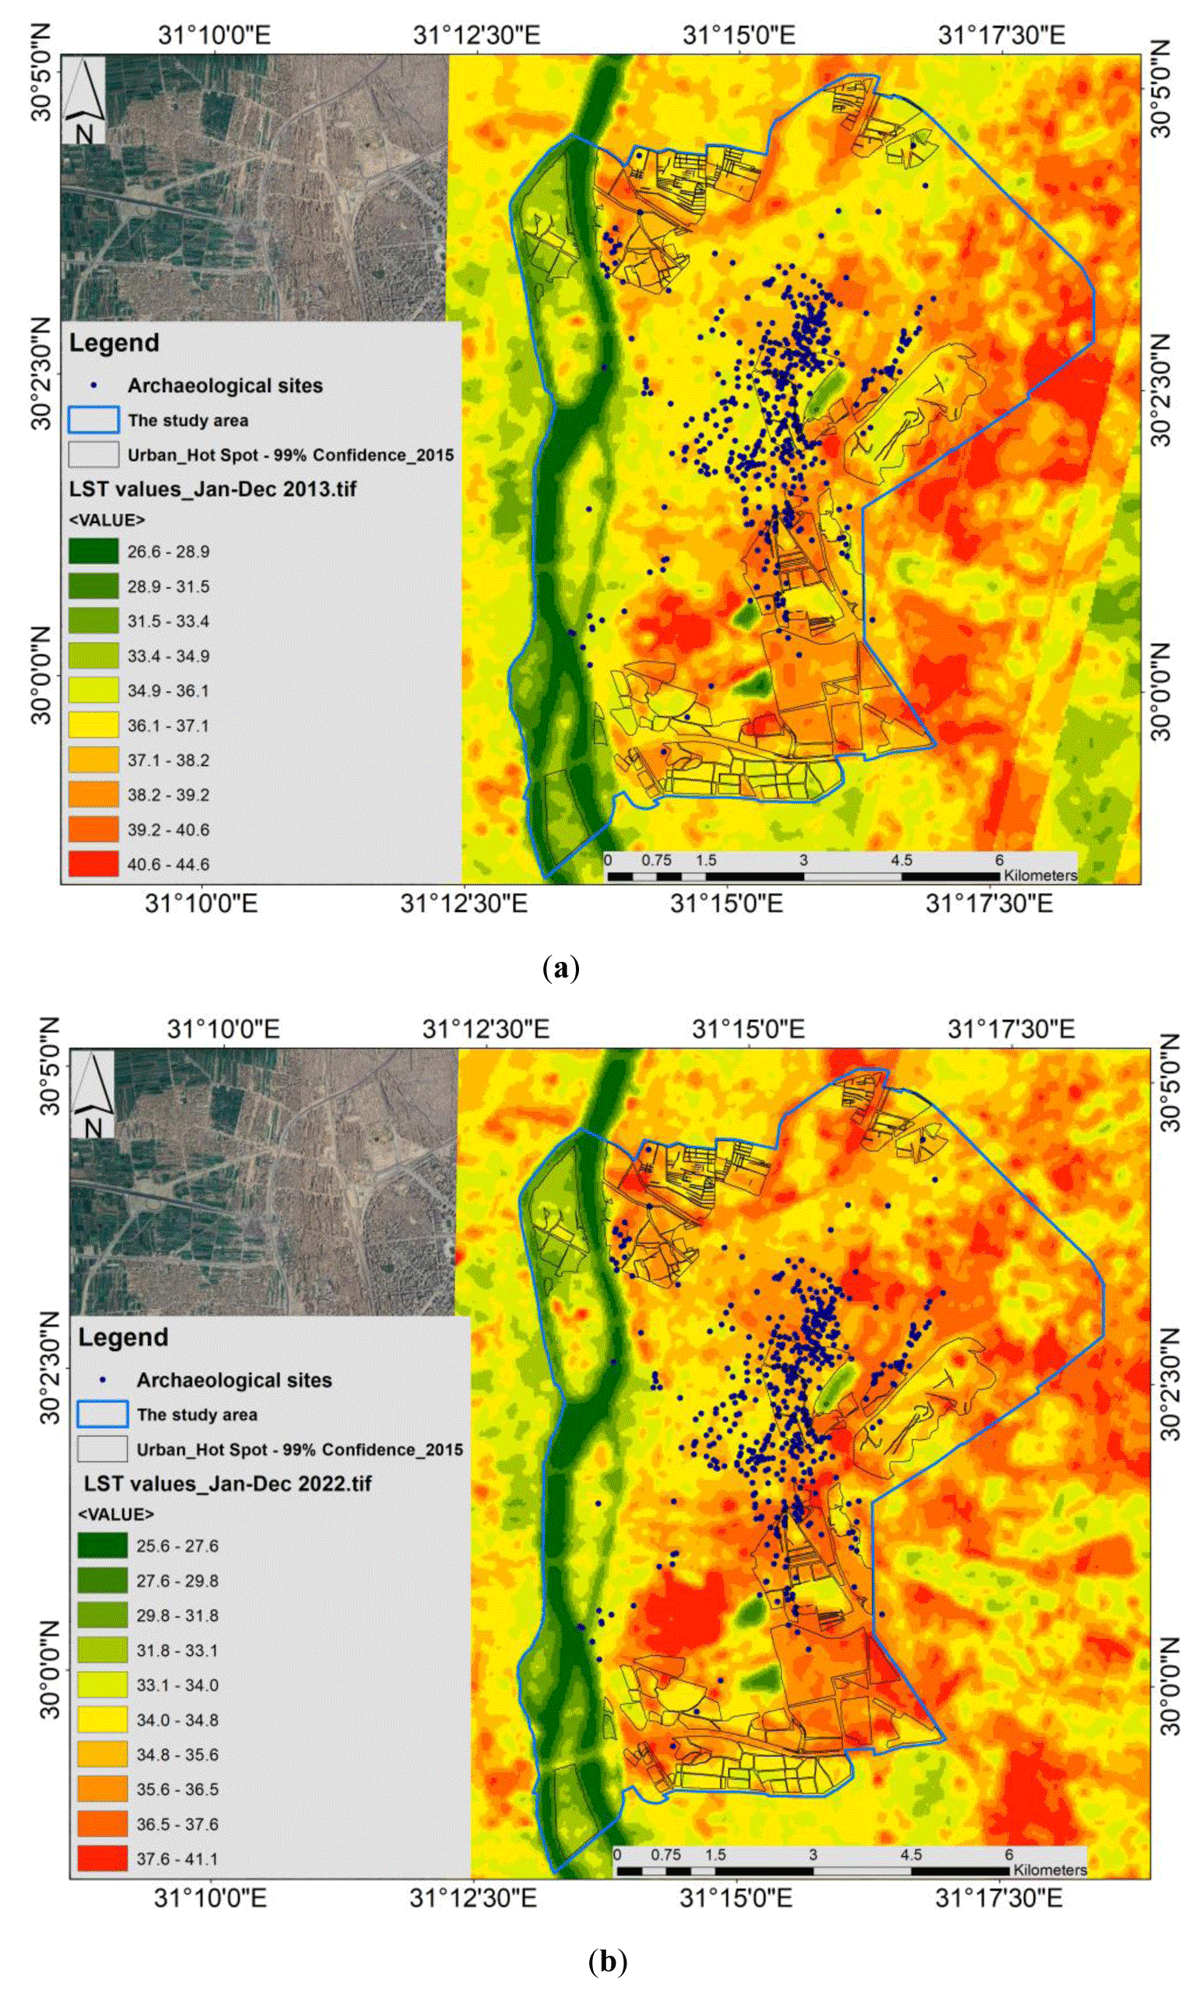
Figure 5
Changes in temperature levels in the regions close to the heritage sites between 2013 and 2022: (a) Land surface temperature in 2013 integrated with hot spot regions with 99% confidence for the urban area in 2015; (b) Land surface temperature in 2022 integrated with hot spot regions with 99% confidence for the urban area in 2015.

Figure 6
The flooding events over the study area in October 2019: (a) The study area before the heavy rain between the 15th and 19th October 2019, (b) The study area during the heavy rain between the 19th and 21st October 2019, (c) The study area after the heavy rain events between 21st and 25th October 2019.

Figure 7
The archaeological sites of Historic Cairo in low, moderate, and high-risk conditions of subsidence during 2016 and 2024: (a) The archaeological sites in the period between July and December 2016; (b) The archaeological sites in the period between June and November 2024.

Figure 8
(a) Field survey using the Syscal Pro equipment near the El Hakim mosque; (b) Field measurements close to the Citadel of Salah Eldin (c) Chosen points for the Syscal measurements based on the areas that suffer from subsidence (between July-December 2016), the hot spot built-up areas, and nearby sub-wadies traces; (d) Chosen points for the Syscal measurements based on the areas that suffer from subsidence (between June-November 2024), the hot spot built-up areas, and nearby sub-wadies traces; (e) 2D interpretation sections of the 2D profiles P1 and P2 obtained from the inversion of Wenner beta data sets: profile no. 1 represents the area close to El Hakim mosque, and profile no. 2 represents the area close to Citadel of Salah Eldin.