
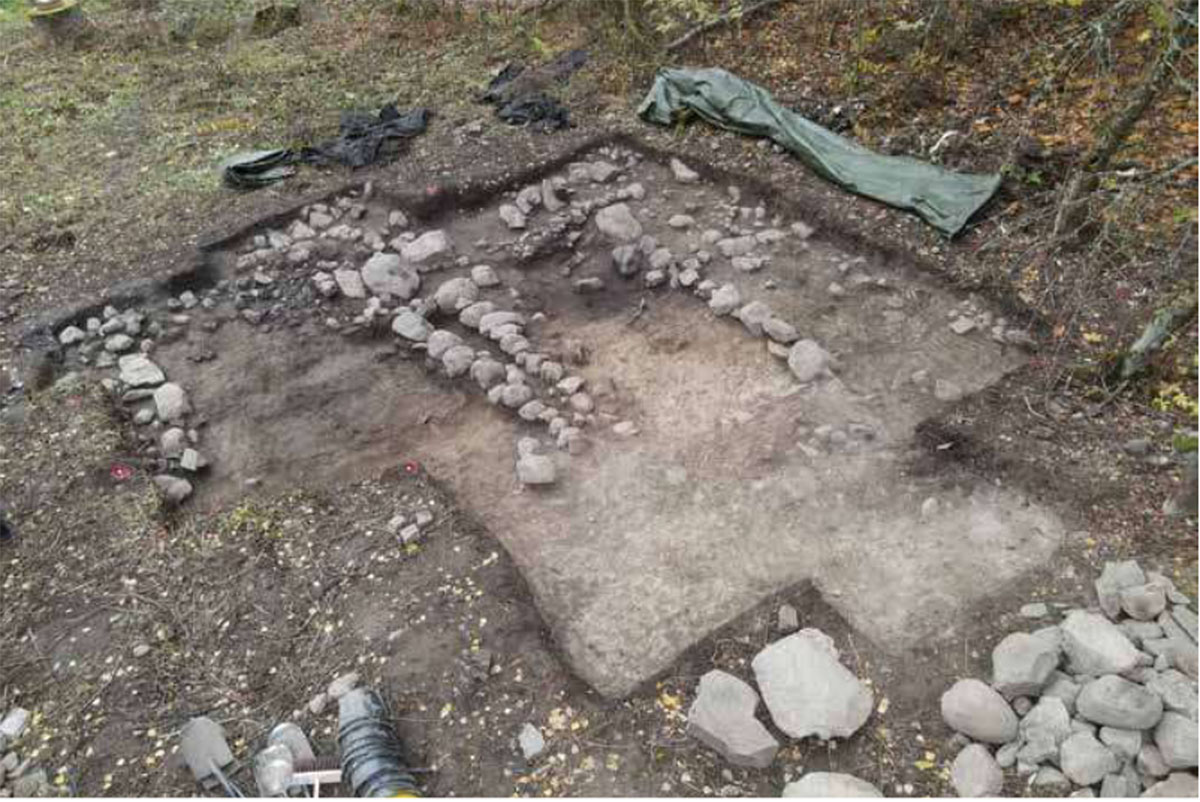
Figure 1
A picture of the Kerava Yli-Jaakkola excavation area from northwest.
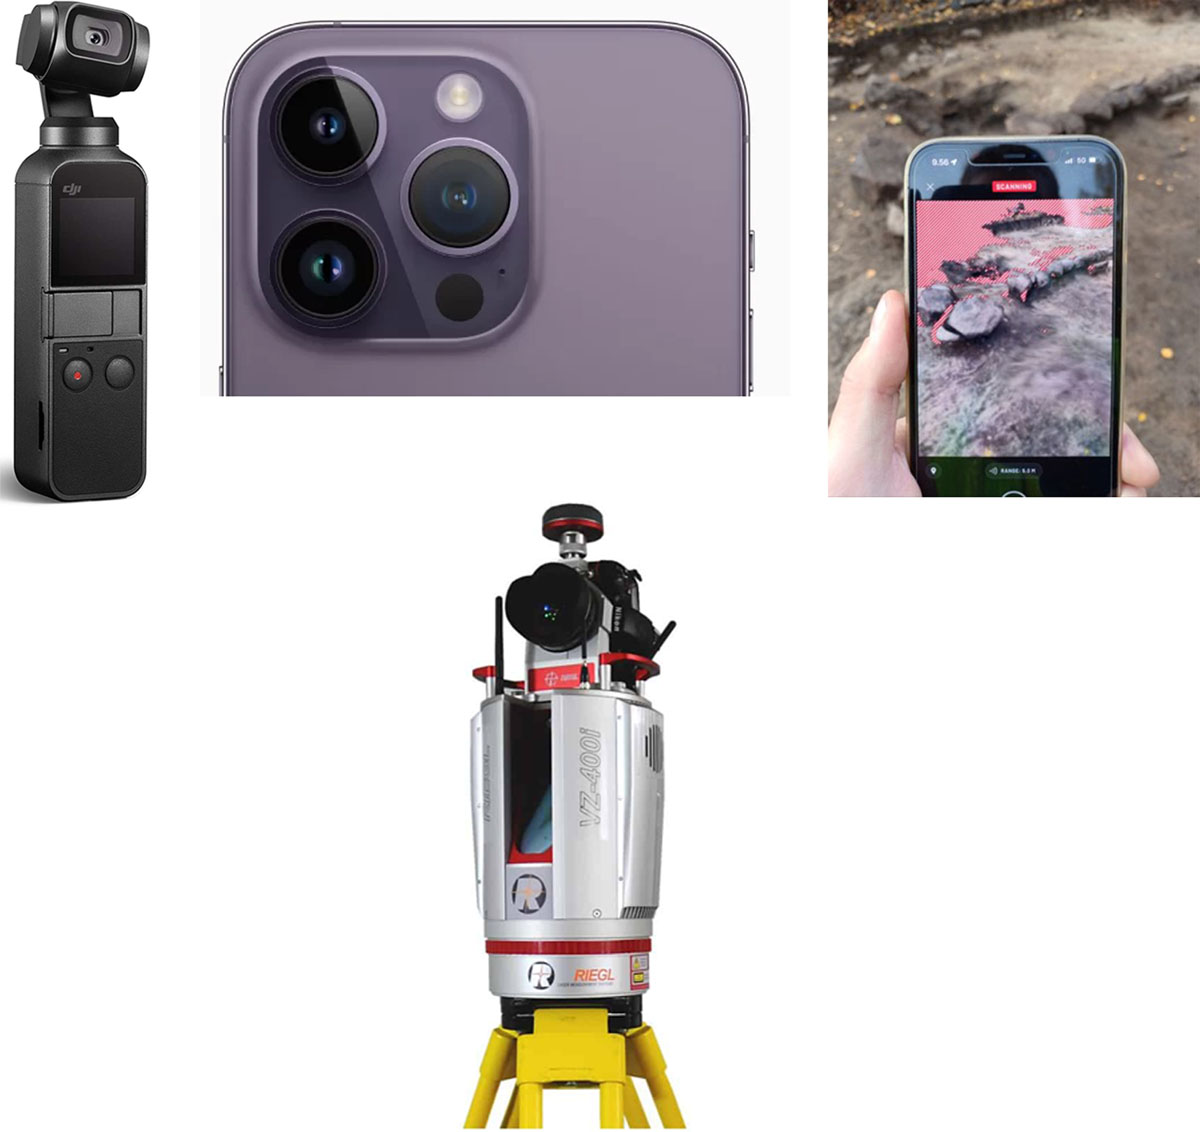
Figure 2
From left to right: DJI Osmo, iPhone LiDAR sensor location, iPhone scanning with onscreen visual feedback, and VZ-400i terrestrial laser scanner.
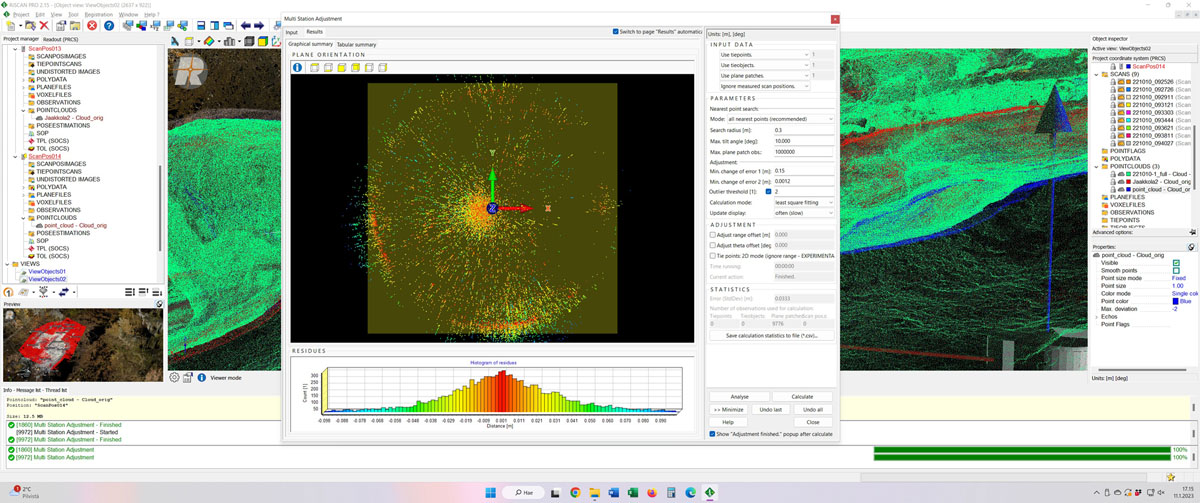
Figure 3
A view of Multi Station Adjustment tool in RiScan Pro software.
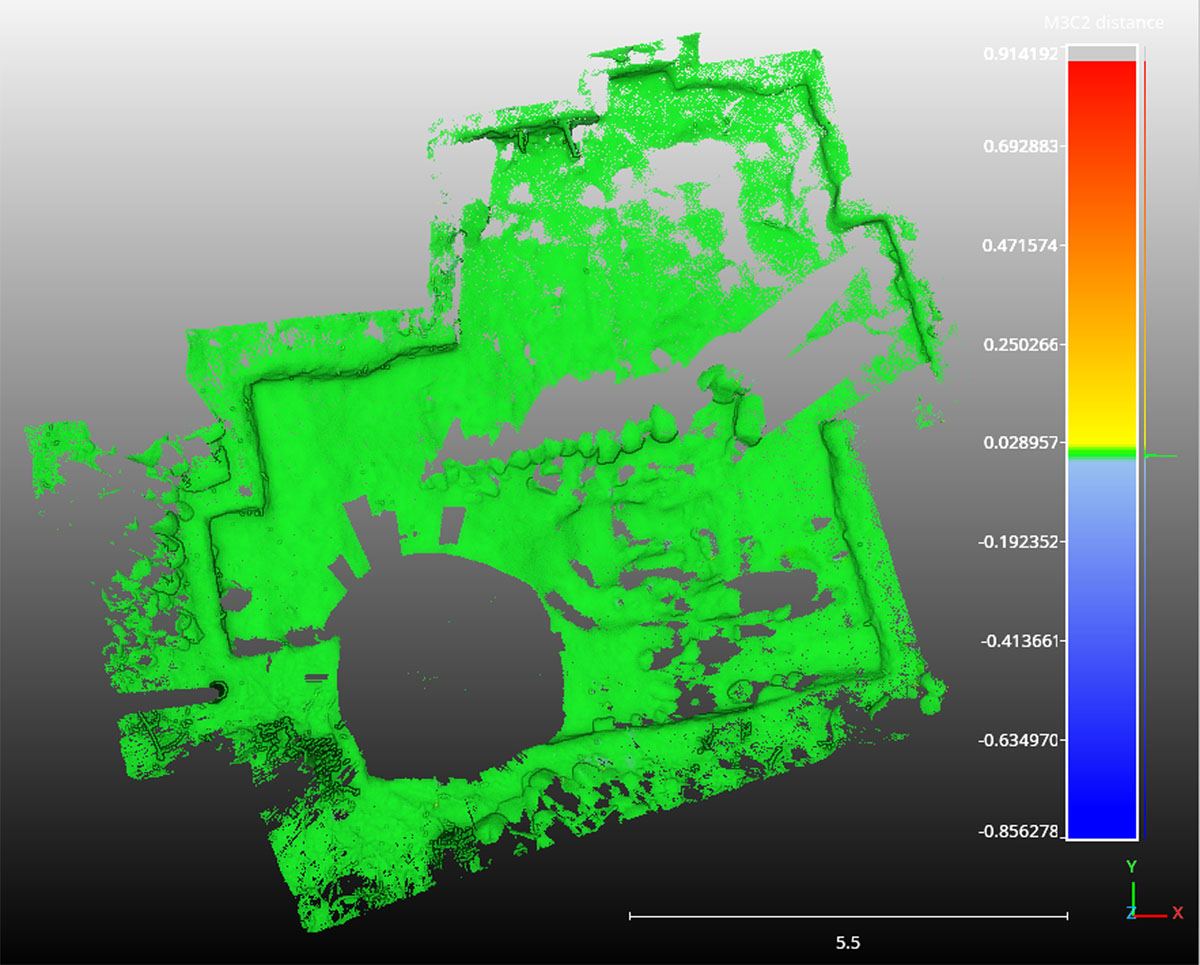
Figure 4
Comparison of two Riegl VZ-400i scanning positions using M3C2 plugin.
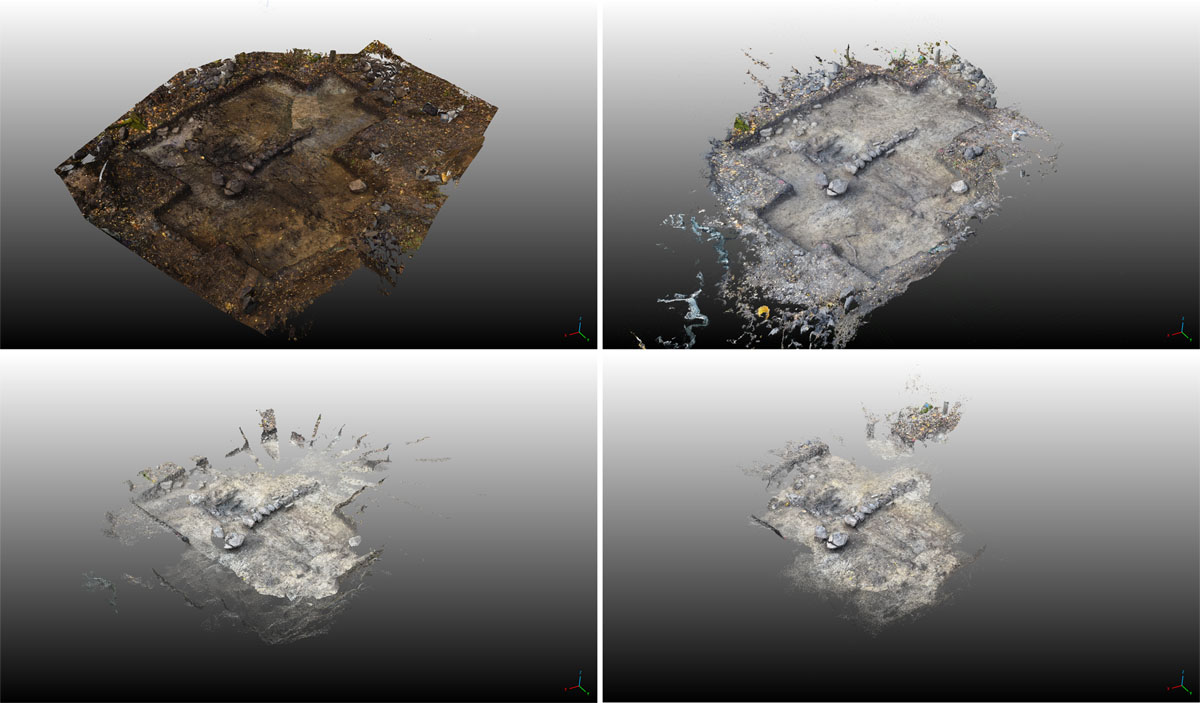
Figure 5
Textured views of four clouds. From left to right: Riegl VZ-400i (cropped), DJI Osmo + RealityCapture, iPhone 12 Pro + Pix4D and iPhone12 Pro + Scaniverse.
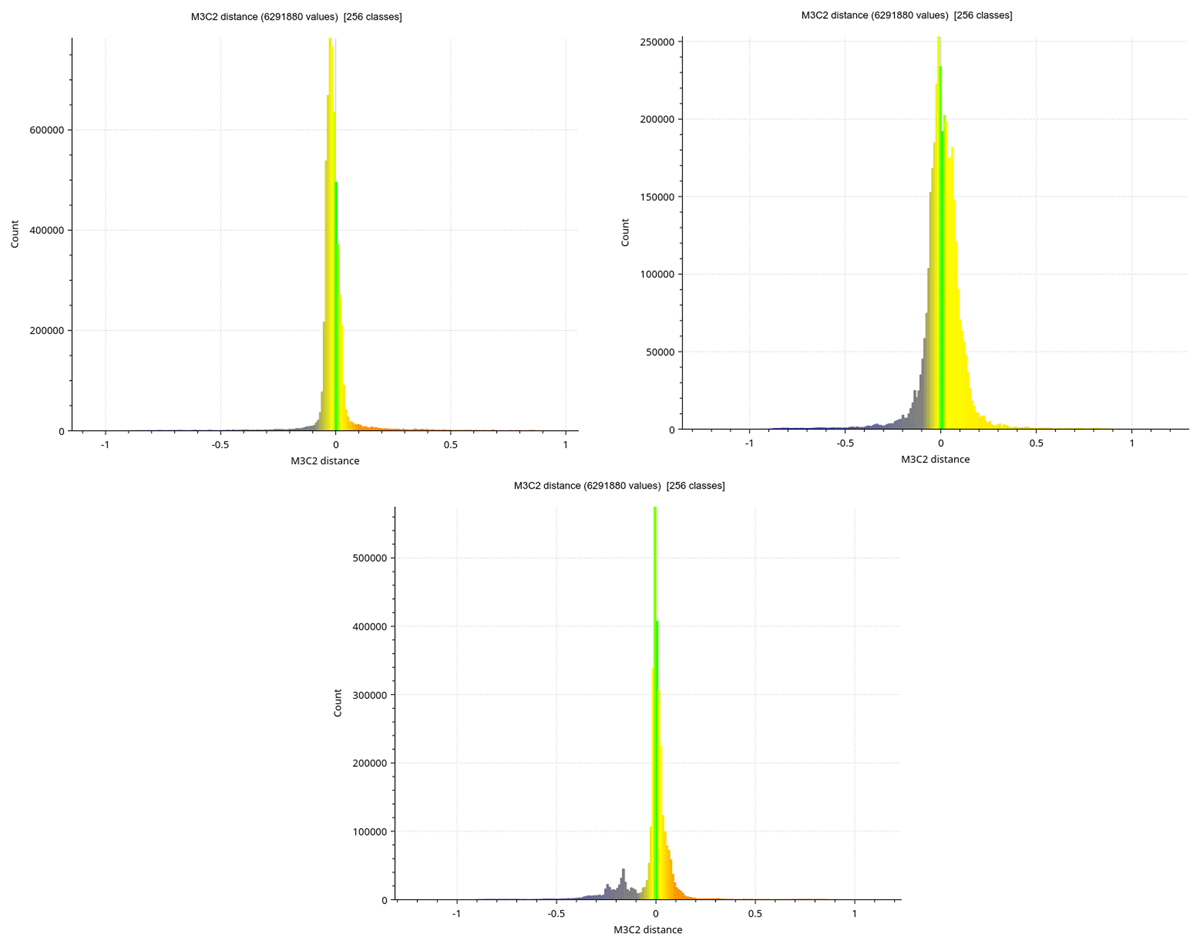
Figure 6
Histograms in descending order: DJI Osmo and RealityCapture, iPhone 12 Pro and Pix4D and iPhone 12 Pro and Scaniverse. M3C2 distance indicates the difference to the reference cloud in meters, whereas Count indicates the number of points falling into that M3C2 range.
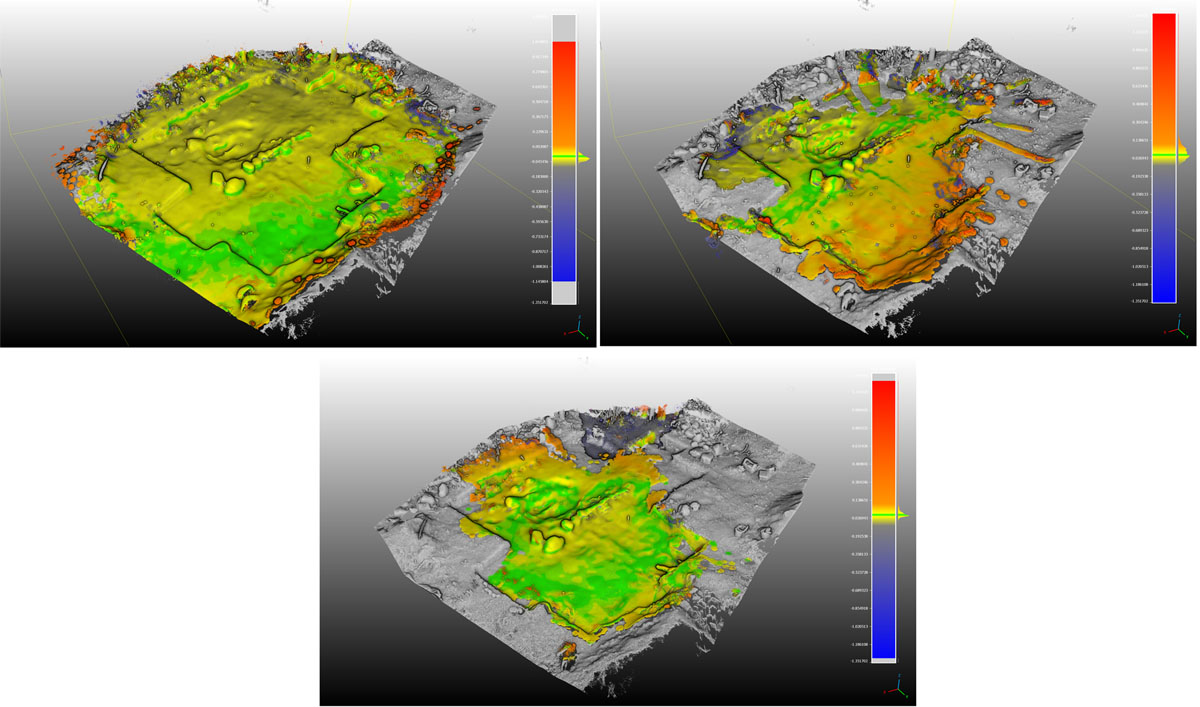
Figure 7
Point clouds colored using Scalar field values of M3C2 comparison. In descending order: DJI Osmo and RealityCapture, iPhone and Pix4D and iPhone and Scaniverse.
Table 1
Errors in point cloud precision by single point according to M3C2 comparison performed in CloudCompare.
| ERROR | MAX – 0.5 | 0.5 TO 0.1 | 0.1 TO 0.05 | 0.05 TO 0.02 | LESS THAN 0.02 |
|---|---|---|---|---|---|
| DJI Osmo + RealityCapture | 0.79% | 4.68% | 4.32% | 45.43% | 44.77% |
| iPhone + Pix4D | 1.08% | 15.39% | 25.13% | 34.54% | 23.86% |
| iPhone + Scaniverse | 1.60% | 25.13% | 14.16% | 16.62% | 42.49% |
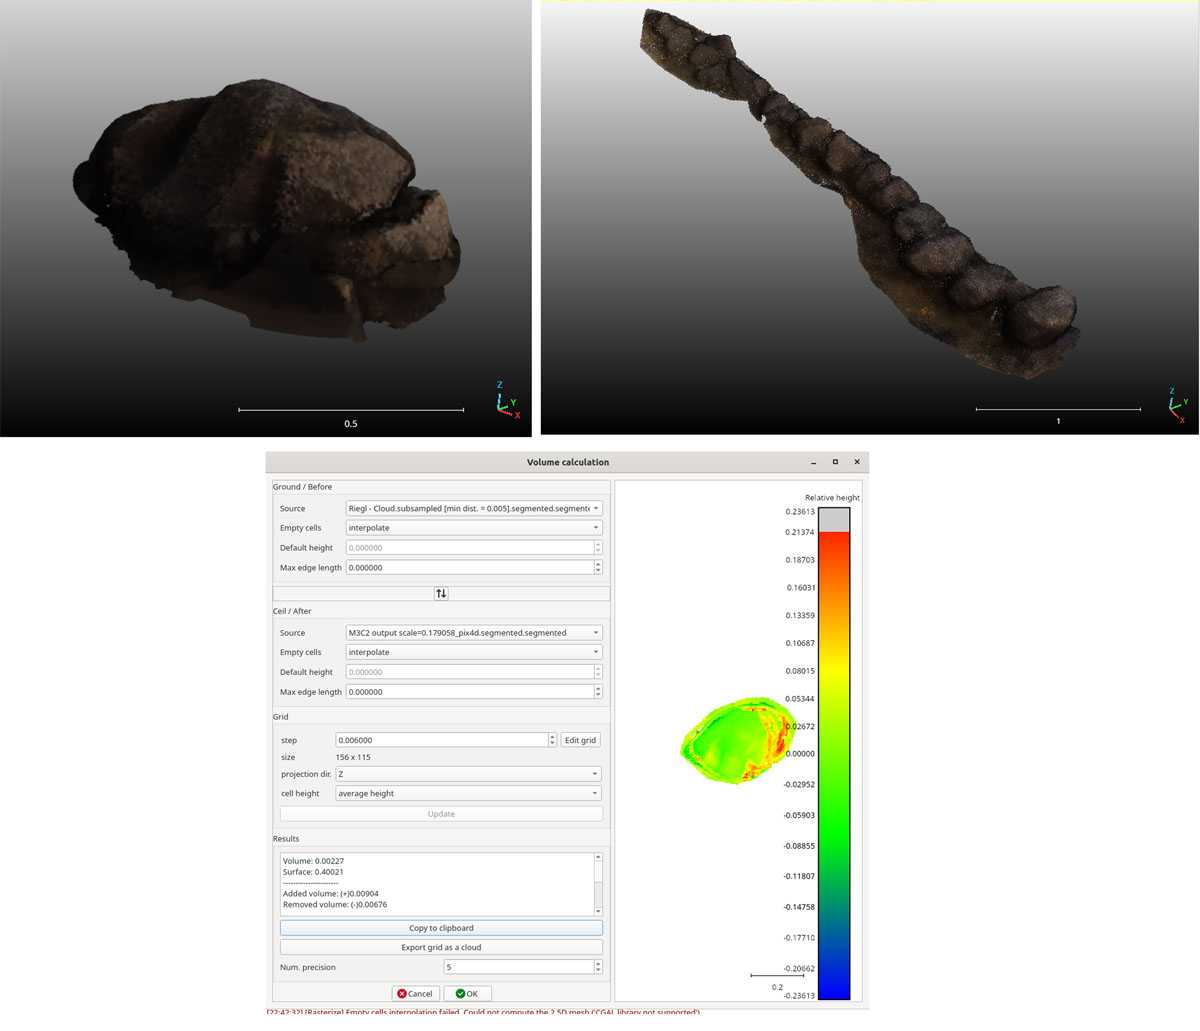
Figure 8
From left to right: The Riegl point cloud of a rock used in the comparisons; the Riegl point cloud of the stone row used in the comparisons and a view of the Calculate 2.5D Volume tool.