
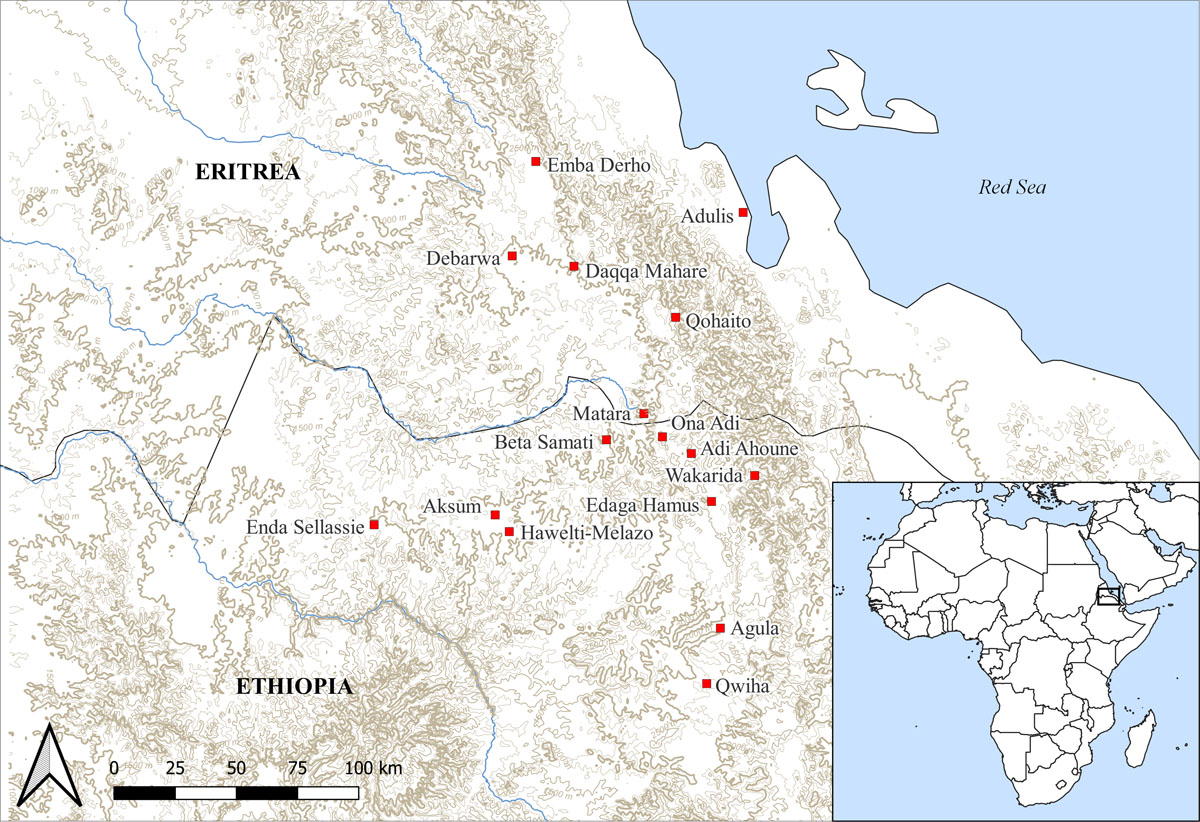
Figure 1
Elevation map of the study area showing the location of the sites included in the model.
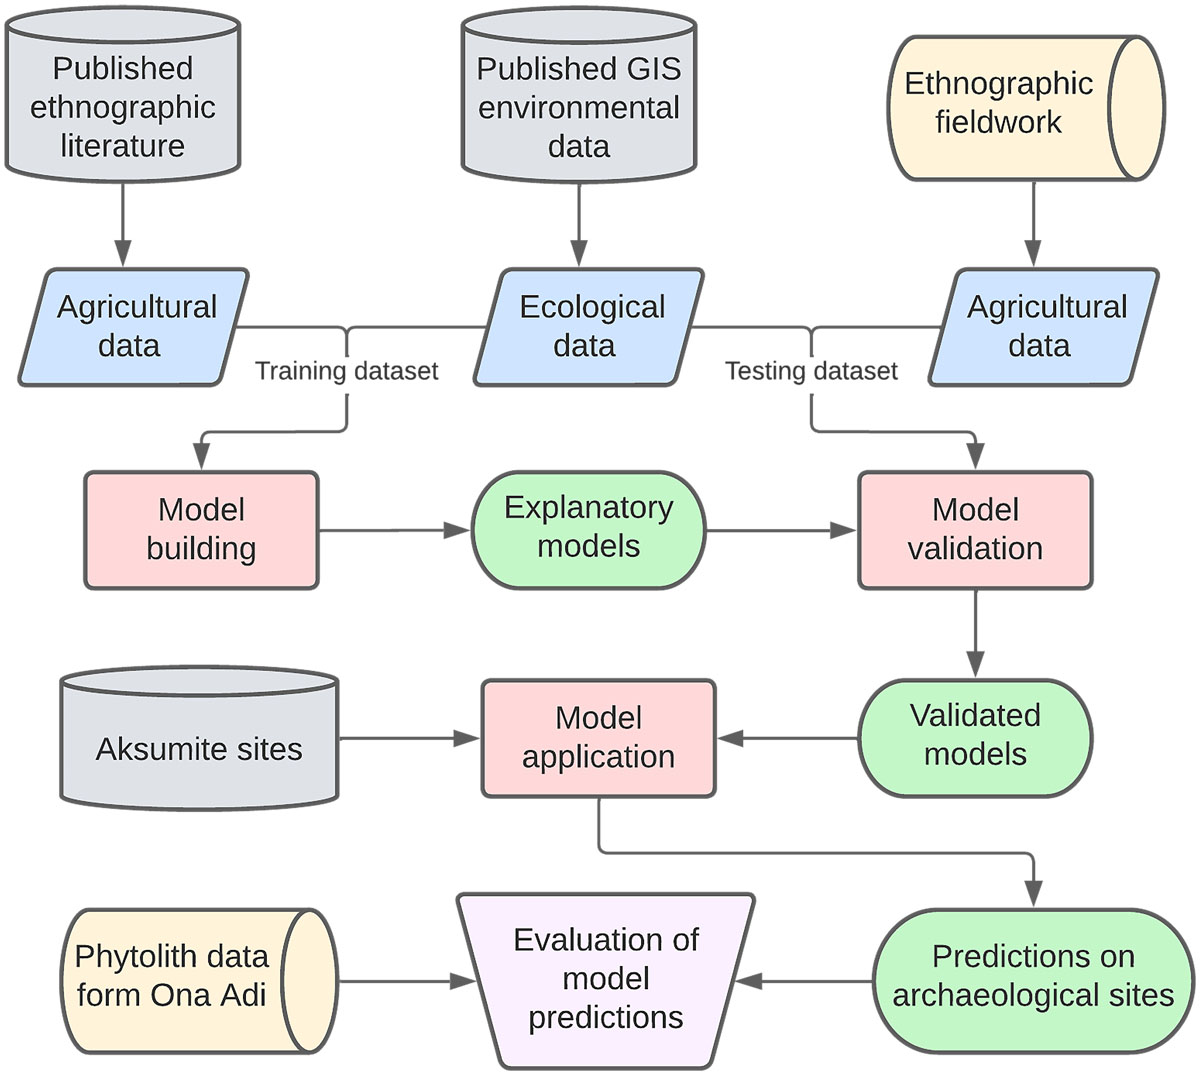
Figure 2
Workflow used in this study. Grey boxes represent previously published data. Yellow boxes contain new data. Blue shapes represent datasets. Processing data steps in R software 4.2.2 (R Core Team 2021) are red rectangles. Green shapes represent the results of R processing.
Table 1
Definitions of agricultural practices considered in this study.
| VARIABLE | DEFINITION | REFERENCES |
|---|---|---|
| Casual Agriculture | Slight or sporadic cultivation of food or other plants incidental to a primary dependence upon other subsistence practice | Murdock 1981: 98 |
| Extensive Agriculture | Or shifting cultivation, as where new fields are cleared annually, cultivated for a year or two, and then allowed to revert to forest or brush for a long fallow period | Murdock 1981: 98 |
| Intensive Agriculture | On permanent fields, utilizing fertilization by compost or animal manure, crop rotation, or other techniques so that fallowing is either unnecessary or is confined to relatively short periods | Murdock 1981: 98 |
| Rainfed Agriculture | Water is provided by rainfall alone (directly or as run-off), cultivation occurs far from any permanent water sources and without any water harvesting | Lancelotti et al. 2019: 1027 |
| Décrue Agriculture | Or floodplain cultivation, as where water is provided by natural inundation, typically from major river systems. | Lancelotti et al. 2019: 1027 |
| Irrigated Agriculture | Water is provided to crops at regular intervals throughout the growing season by human intervention | Lancelotti et al. 2019: 1027 |
Table 2
Performance measures of model fitting and cross-validation using different classification thresholds (Acc. = Accuracy, Prec. = Precision, Rec. = Recall, F1 = F1-Score).
| MODEL | METHOD | MODEL FITTING | CROSS-VALIDATION | ||||||
|---|---|---|---|---|---|---|---|---|---|
| ACC. | PREC. | REC. | F1 | ACC. | PREC. | REC. | F1 | ||
| Crop choice | Sens = Spec | 0.77 | 0.84 | 0.75 | 0.80 | 0.63 | 0.89 | 0.93 | 0.76 |
| MaxSens + Spec | 0.81 | 0.94 | 0.73 | 0.82 | 0.54 | 0.67 | 0.52 | 0.67 | |
| MaxPCC | 0.85 | 0.85 | 0.92 | 0.88 | 0.89 | 0.89 | 1.00 | 0.94 | |
| PredPrev = Obs | 0.82 | 0.86 | 0.84 | 0.85 | 0.89 | 0.89 | 1.00 | 0.94 | |
| ObsPrev | 0.76 | 0.93 | 0.64 | 0.76 | 0.54 | 0.93 | 0.52 | 0.67 | |
| MinROCdist | 0.81 | 0.91 | 0.74 | 0.82 | 0.54 | 0.93 | 0.52 | 0.67 | |
| FM cultivation | Sens = Spec | 0.95 | 0.95 | 0.95 | 0.95 | 0.49 | 0.48 | 0.49 | 0.48 |
| MaxSens + Spec | 0.95 | 0.95 | 0.95 | 0.95 | 0.49 | 0.48 | 0.49 | 0.48 | |
| MaxPCC | 0.95 | 0.95 | 0.95 | 0.95 | 0.49 | 0.48 | 0.49 | 0.48 | |
| PredPrev = Obs | 0.95 | 0.95 | 0.95 | 0.95 | 0.49 | 0.48 | 0.49 | 0.48 | |
| ObsPrev | 0.62 | 0.75 | 0.35 | 0.48 | 0.4 | 0 | 0 | 0 | |
| MinROCdist | 0.95 | 0.95 | 0.95 | 0.95 | 0.49 | 0.48 | 0.49 | 0.48 | |
| SB cultivation | Sens = Spec | 0.8 | 0.67 | 0.78 | 0.72 | 0.73 | 0.6 | 0.67 | 0.63 |
| MaxSens + Spec | 0.78 | 0.63 | 0.85 | 0.72 | 0.71 | 0.55 | 0.7 | 0.62 | |
| MaxPCC | 0.89 | 0.85 | 0.84 | 0.84 | 0.98 | 0.98 | 0.98 | 0.98 | |
| PredPrev = Obs | 0.86 | 0.79 | 0.79 | 0.79 | 0.93 | 0.93 | 0.85 | 0.89 | |
| ObsPrev | 0.63 | 0.44 | 0.35 | 0.39 | 0.41 | 0.03 | 0.02 | 0.02 | |
| MinROCdist | 0.79 | 0.64 | 0.81 | 0.72 | 0.67 | 0.5 | 0.57 | 0.53 | |
Table 3
Summary of the results of the model application to 16 archaeological sites in percentage. The full results are available as Supplementary Information, Table S1 (FM = Finger millet, SB = Sorghum, CAS = Casual, EXT = Extensive, INT = Intensive, RF = Rainfed agriculture, DEC = Décrue/Flood agriculture, IRR = Irrigated agriculture). Note that length of growing cycle was not used for FM as it was not retained by the model as a significant explanatory variable.
| MODEL | 1 KM | 5 KM | 10 KM | 25 KM | 50 KM | 100 KM | 200 KM | |
|---|---|---|---|---|---|---|---|---|
| Crop choice | FM | 93.75 | 93.75 | 87.5 | 87.5 | 93.75 | 62.5 | 93.75 |
| SB | 18.75 | 31.25 | 43.75 | 43.75 | 87.5 | 100 | 100 | |
| FM cultivation | EXT-RF | 91.67 | 92.86 | 92.31 | 92.86 | 66.67 | 90.91 | 93.33 |
| INT-RF | 8.33 | 7.69 | 7.69 | 7.14 | 33.33 | 9.09 | 6.67 | |
| INT-IRR | 0 | 0 | 0 | 0 | 0 | 0 | 0 | |
| SB cultivation (90 days) | CAS-RF | 0 | 0 | 0 | 0 | 0 | 0 | 0 |
| EXT-RF | 0 | 0 | 0 | 0 | 0 | 0 | 0 | |
| INT-RF | 0 | 0 | 0 | 0 | 0 | 0 | 0 | |
| INT-DEC | 0 | 0 | 0 | 0 | 0 | 0 | 0 | |
| INT-IRR | 100 | 100 | 85.71 | 100 | 100 | 93.75 | 100 | |
| SB cultivation (120 days) | CAS-RF | 0 | 0 | 0 | 0 | 0 | 0 | 0 |
| EXT-RF | 0 | 0 | 0 | 0 | 0 | 0 | 0 | |
| INT-RF | 33.33 | 33.33 | 71.43 | 75 | 64.29 | 75 | 100 | |
| INT-DEC | 0 | 0 | 0 | 0 | 0 | 0 | 0 | |
| INT-IRR | 66.67 | 80 | 28.57 | 25.0 | 28.57 | 12.5 | 0 | |
| SB cultivation (150 days) | CAS-RF | 0 | 0 | 0 | 0 | 0 | 0 | 0 |
| EXT-RF | 0 | 0 | 0 | 0 | 0 | 0 | 0 | |
| INT-RF | 100 | 100 | 100 | 100 | 100 | 100 | 100 | |
| INT-DEC | 0 | 0 | 0 | 0 | 0 | 0 | 0 | |
| INT-IRR | 0 | 0 | 0 | 0 | 0 | 0 | 0 | |
| SB cultivation (180 days) | CAS-RF | 0 | 0 | 0 | 0 | 0 | 0 | 0 |
| EXT-RF | 0 | 0 | 28.57 | 25 | 0 | 0 | 0 | |
| INT-RF | 100 | 100 | 71.43 | 62.5 | 85.71 | 93.75 | 100 | |
| INT-DEC | 0 | 0 | 0 | 0 | 0 | 0 | 0 | |
| INT-IRR | 0 | 0 | 0 | 0 | 0 | 0 | 0 | |
| SB cultivation (210 days) | CAS-RF | 0 | 0 | 0 | 0 | 0 | 0 | 0 |
| EXT-RF | 33.33 | 40 | 71.43 | 62.5 | 78.57 | 100 | 100 | |
| INT-RF | 66.67 | 66.67 | 28.57 | 37.5 | 28.57 | 18.75 | 0 | |
| INT-DEC | 0 | 0 | 0 | 0 | 0 | 0 | 0 | |
| INT-IRR | 0 | 0 | 0 | 0 | 0 | 0 | 0 | |
| SB cultivation (240 days) | CAS-RF | 0 | 0 | 0 | 0 | 0 | 0 | 0 |
| EXT-RF | 100 | 100 | 100 | 100 | 100 | 100 | 100 | |
| INT-RF | 33.33 | 20 | 0 | 12.5 | 0 | 0 | 0 | |
| INT-DEC | 0 | 0 | 0 | 0 | 0 | 0 | 0 | |
| INT-IRR | 0 | 0 | 0 | 0 | 0 | 0 | 0 | |
Table 4
Summary of results from single-celled phytolith analysis grouped by taxonomic categories.
| ARCHAEOLOGICAL CONTEXT | INDETERMINATE HERBACEOUS | C4 | C3 | PALMS AND HERBS | WEEDS | |||||||||||||||
|---|---|---|---|---|---|---|---|---|---|---|---|---|---|---|---|---|---|---|---|---|
| N SAMPLES | POACEAE/CYPERACEAE (%) | POACEAE (%) | ANDROPOGONEAE (%) | CF. ARISTIDOIDEAE (%) | PANICOIDEAE/CHLORIDOIDEAE (%) | PANICOIDEAE/CHLORIDOIDEAE (%) | PANICOIDEAE (%) | CHLORIDOIDEAE (%) | CF. CHLORIDOIDEAE (%) | POOIDEAE (%) | POOIDEAE (%) | ARECACEAE (%) | ZINGIBERALES (%) | CF. ZINGIBERALES (%) | CYANOTIS SP. (%) | COMMELINA SP. (%) | COMMELINACEAE (%) | CYPERACEAE (%) | NON DIAGNOSTIC (%) | |
| Late Pre-Aksumite | 4 | 29.4 | 28 | 0 | 0 | 7.4 | 1.4 | 0.2 | 9.3 | 0.3 | 4.3 | 0.2 | 1 | 0 | 0.1 | 0 | 0 | 0 | 2.6 | 15.6 |
| PAA transition | 10 | 24.3 | 31.7 | 0.1 | 0.04 | 7.7 | 1.1 | 0.3 | 10.2 | 0.2 | 4.4 | 0.3 | 1.4 | 0.2 | 0 | 0.2 | 0 | 0 | 2 | 15.9 |
| Early Aksumite | 9 | 24.7 | 35.1 | 0.04 | 0.04 | 8.1 | 1.2 | 0.1 | 9.2 | 0.1 | 3.4 | 0.2 | 1.4 | 0 | 0.04 | 0 | 0 | 0 | 1.6 | 14.8 |
| Middle Aksumite | 9 | 28.5 | 30.5 | 0 | 0 | 10.1 | 1.1 | 0.2 | 7.7 | 0.4 | 3.5 | 0.3 | 1 | 0 | 0 | 0.4 | 0.04 | 0.04 | 1.2 | 14.8 |
| Late Aksumite | 14 | 31.1 | 26.9 | 0 | 0 | 10 | 0.4 | 0.1 | 7.5 | 0.2 | 4.2 | 0.2 | 0.6 | 0.03 | 0.03 | 0.1 | 0 | 0 | 2 | 16.9 |
| Total Ona Adi | 46 | 27.7 | 30.4 | 0.02 | 0.02 | 9 | 0.9 | 0.2 | 8.6 | 0.2 | 4 | 0.2 | 1 | 0.04 | 0.02 | 0.1 | 0.01 | 0.01 | 1.8 | 15.7 |
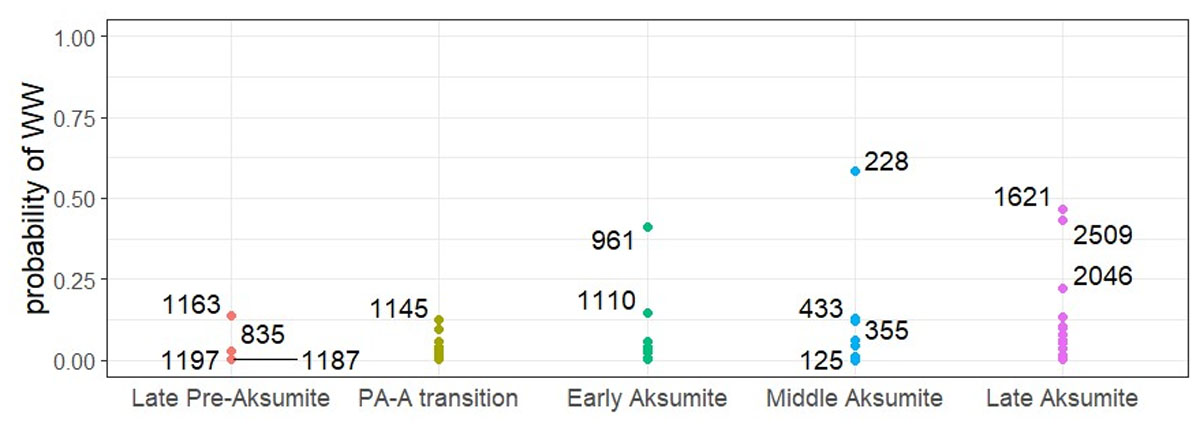
Figure 3
Plot of the probability of Ona Adi’s archaeological phytolith samples to be derived from a wellwatered crop-phytolith assemblage.