
1. Introduction
A 19th-century cemetery reflects the social organization of a city. This idea, already defended from a historical perspective by several researchers in different countries (André 2006; Ragon 1981), was the starting point for our investigation. Could network theory in archaeology demonstrate that a 19th-century Lisbon cemetery was organized according to social and cultural influences? We aimed to answer this question, at least partially, using a Lisbon cemetery (Ajuda) (Figure 1)1 through the combination of movement and visibility networks. The study of how people circulated when visiting a contemporary cemetery has never been approached archaeologically, and although some studies using network theory in cemeteries already exist, they have different objectives (Sosna et al. 2012).

Figure 1
Map of the Ajuda cemetery with its two parts. On the right is the 18th-century foundation and on the left is the 1940s addition.
However, although the movement of people in these spaces has never been analysed, we know that 19th-century cemeteries were conceptualized to reflect urban spaces with roads, squares, and buildings where people circulated (Petruski 2006). So, as a methodological base for our study, we draw inspiration from a considerable number of papers that were written about the pedestrian movement of people in urban spaces, even if they do not mention cemeteries (Branting 2004; Crawford 2019; Pailes 2014; Poehler 2016; Poehler 2017; Thaler 2005). Despite this similar approach, we must be aware that cemeteries cannot be considered open spaces. For the study of movement within their walls, we draw our inspiration from studies applying network analysis made in confined places, such as houses, a type of analysis made mainly by architects and urbanists (Hillier & Hanson 1984) and successively adapted for archaeology using visibility networks (Brughmans & Brandes 2017; Turner et al. 2001). In this study, we will apply and connect both approaches, movement and visibility.
Katherine Crawford (2019: 314), wrote that ‘the majority of pedestrian movement, arguably, would have occurred with pedestrians having intended destinations or varying levels of knowledge of the urban landscape they traverse.’ Even though this idea was developed considering urban open spaces, it will also be used in our analysis since when people visited cemeteries, they moved intentionally.
When founded in the first half of the 19th century, these were peripheral urban public spaces that rapidly became part of the city and were organized in a way that reflected the organization and conceptualization of the social space people experienced there. The cemetery
‘n’est pas seulement un lieu pour enterrer les morts, c’est aussi un lieu où l’on va, où les vivants vont voir leurs morts. La cimetière devient (…) le lieu central des pratiques funéraires, le théâtre d’une révolution des mentalités, dont les effets se font sentir jusqu’à nos jours’ (Bertherat 2018: 37).
Cemeteries were thus built with the intention of reflecting social behaviours, where people would continue to show in death, the power and status which distinguished them in life (Queiroz 2002). Urban tendencies in Portugal, as in other countries, were for rich and noble people to own the best houses. The same would happen in cemeteries, where rich people owned the largest and best decorated tombs (almost a symbolic home) and were responsible for the transformation of the space within the cemetery (André 2006). Considering this assumption, this paper shows, using network theory, that “distinguishable” people positioned their tombs in places that would intentionally be most visited and observed.
To unite ‘theory and method for archaeological network research (…) evaluating specific statements and dependencies among nodes, edges, network properties, generative processes, attributes, and outcomes’ (Brughmans & Peeples 2023: 275), we created hypotheses regarding 19th-century cemeteries’ spatial organization, which we proved during our investigation using network methods. The main theory discusses how cemeteries reflect social patterns and behaviours and how people’s circulation in cemeteries may reflect those social organizations. To test this, we analysed the location of distinguishable tombs with people of high social status buried inside in specific places within the cemetery. We identified 13 of these tombs, selected based on their monumentality, hypothesizing that they were where people would be most likely to pass. Another hypothesis is about the attraction concept. We believe that some tombs created an attraction, and nearby tombs took advantage of that attraction. The method used to support this theory was the viewshed approach. One final theory relates to how we can analyze movement inside a closed space. Closed places have specific entrances, and so using certain centrality measures, such as betweenness, which measures the movement of people from every node, would not be accurate, bearing in mind that in a cemetery, everyone starts their tour in the same place: the doors. To overcome this challenge, we propose adapting the betweenness centrality measure.
‘Network science in archaeology is the application of network science methods to the study of the human past’ (Brughmans & Peeples 2023: 275), which is what we did in this paper. Recovering the information provided by the location and visual monumentality of more than 700 tombs within a Lisbon cemetery and debating how people circulated within them permitted us to create a debate about how important certain tombs were when discussing the social importance of cemeteries and how they reflected social networks.
2. Historical Context
The Ajuda cemetery was founded in 1787 by request of Queen Maria I to bury not only the poor people of the Ajuda and Belém parishes but also the servants of the royal house (Matos & Neto 1994). This may be related to the fact that the palace where the royal family had lived since 1755 – known as the Ajuda Palace – was located nearby, employing hundreds of people who also called the royal palace their home. However, except for one tomb whose epitaph names it as the final resting place of the king’s hunter, there is no other information concerning people who worked for the royal family. This does not mean they were not there. However, the epitaphs do not reflect it, or maybe people were buried in shallow graves and are thus not contemplated in this paper.
Around that time, the kingdom’s superintendent Pina Manique, requested a survey of the city, searching for three locations to establish three cemeteries that would guarantee that the burial of people in churches did not compromise public health (Janin-Thivos 2016). Ajuda was probably the only one that resulted from that urban survey, and it took many decades for other cemeteries to be built despite the concerns about those practices that affected public health.
The same concerns existed in other European countries, although most populations continued with the medieval habit of burying people inside or around churches (Ragon 1981). However, with the population growth of the 19th century, churches could no longer manage the dead sustainably, and people started to complain about the putrid air (André 2006). Consequently, other cemeteries were founded in the city, namely Prazeres (1834) and Alto de São João (1835), reflecting how the city was adapting to new ways of experiencing death (Feijó, Martins & Cabral 1985). Considering this problem, in September 1835, a first law was passed recommending that every city and village in the country should have a public cemetery and everyone should be buried there, albeit with some exceptions (Matos & Neto 1994).
A year before this law, a publication in the Gazeta do Governo defined how these new cemeteries should be organized:
‘These places will have a regular organization adapted to the terrain where they are located, with a closed door, with an inscription declaring the nature of the place and the year it was founded. A decent church and houses for their employees will be built inside. The area of these cemeteries will be divided into three types: a place where trenches will be open for general burials, a second area for general graves identified with a plaque number, and a third area for large tombs’ (Gazeta Official do Governo, nº35, Saturday 9 August 1834: p. 141).
Although founded nearly 50 years before the law, the Ajuda cemetery already followed all these rules, probably meaning that the leading figures of the kingdom were in line with public administration. Finally, in 1844, a new law erased all the exceptions, and everyone had to be buried in public cemeteries unless a royal decree permitted otherwise.
In 1841 the Lisbon City Hall, after receiving from the royal family the management of the Ajuda cemetery, acquired a copy of the regulation of the Père-Lachaise (Paris-France) cemetery (André 2006), copying its organizational model. These cemeteries reflected the social organization of the cities, and Lisbon was no exception, following those same models. In 1835 a doctor named Sousa Vaz published an interesting work about how cemeteries could be used by important families as places of memory, transforming their tombs into pieces of art, something that could never be achieved when they were buried in churches. This motivated the social differentiation of architecture which was visible in the cities, inside the cemeteries (Vaz 1835).
The cemetery nowadays occupies approximately five hectares, divided into two main sections: the old area, founded in 1787 (Figure 1 right side), and a new area, added to the primitive cemetery in the early 1940s (Figure 1 left side). The grave types are variable and correspond mainly to three categories: small buildings called jazigos located along the cemetery streets, corresponding to family tombs; individual ground burials (campas), divided into temporary and permanent and mostly identified with a plate number; and drawers (gavetas) where, a few decades after the burial, the bones are stored. The Ajuda cemetery is organized as follows: The jazigos are located along the streets, and the shallow graves are located on the backs of these jazigos. These buildings’ façades are turned towards the streets, and people can observe them while circulating. As for the graves area, there are no circulation paths among them, and people must walk carefully in order not to step on any of them, even those with no tombstone since it is considered offensive. In the late 20th century, one of these areas, to the left of the entrance, was transformed into a cremation ash deposit where families can deposit ashes resulting from cremation, and is distinguished from the remaining areas by the green grass planted there.
3. Materials and Methods
3.1 The survey
Several aspects related to the structural organization of the cemeterial space were considered in the development of this paper, namely its dimension, internal organization, access points and evidence related to the people buried there. Although the cemetery contains shallow graves, ossuaries, and tombs similar to small buildings (henceforth called tombs), only the last were considered for this paper (742 tombs dating from 1841 to 2020). One must bear in mind that these tombs were expensive and that we are only analysing the mortuary practices of a limited number of people (Monteiro 2022). Less wealthy people were buried in unmarked shallow graves, and we did not have access to the information relating to those tombs.
Before starting the field survey, archival research was carried out at the Lisbon Historical Archive, where we found maps and documents concerning the evolution of the cemetery. Although founded in 1787 the oldest known map is dated 1911 (Figure 2), which enabled us to confirm that the primitive area of the cemetery was the same size as it is today (Figure 1 right side). The cemetery did not change much over the years. Early 20th-century photographs reveal that the tombs were in the same place they are today (Figure 3). Most of our investigation will focus on the older area of the cemetery (Figure 1 right side), since most of the tombs we will work on were built before the new area (Figure 1 left side) was constructed (around the 1940s). Only one group of tombs built after the 1940s will be analysed. For this last investigation, we will consider the cemetery as a whole (Figure 1 complete).
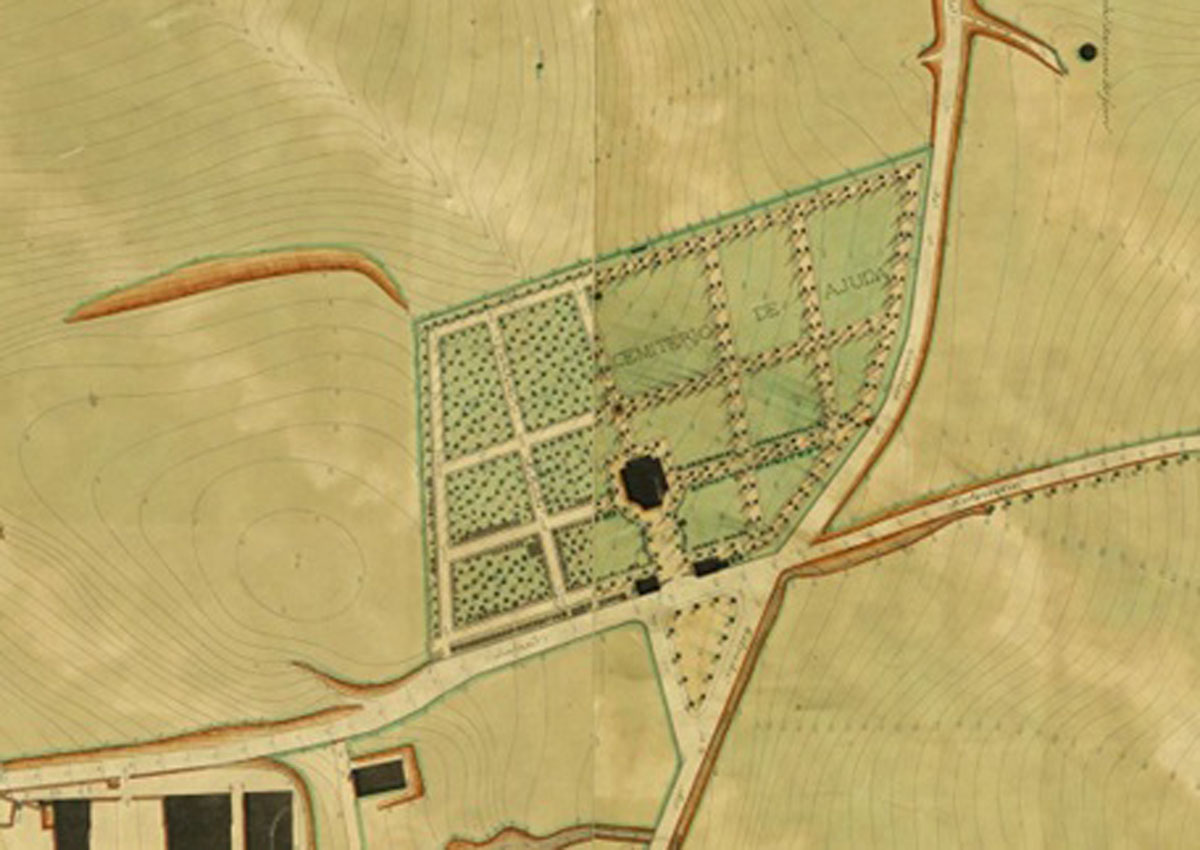
Figure 2
Map of the Ajuda cemetery in 1911 by Silva Pinto.

Figure 3
View from one of the streets in 1942 and in 2023 (courtesy of the Lisbon Historical Archive).
The first step in our archaeological survey was to understand the structure of the cemetery. As a reflection of urban organization, it has streets, entrances, crossroads, and buildings. Since each road is already numbered, to avoid confusion, we used the official street numbers, ending up with 13 different roads. Each of these streets was surveyed, and every tomb in them was registered considering location (street), official number (number given to every tomb by the cemetery administration), date (when available), style (based on ten different typologies we associated to architectural features), gender (either male or female), epitaphs (personal and family name) and differences indecoration (statues, crosses, doors, among others). We created a database with all the information and hundreds of general and specific photographs for each tomb. The amount of data collected was enormous; most of it is not presented in this paper, and it will be used in future investigations.
After finishing the survey, the next step was to understand the chronological evolution of the tombs. Considering the more than 700 hundred small buildings and the diversity of dates, a compromise was made to organize them in clusters. Six moments of 25 years each were identified (the length of a generation): <1875; 1875–1900; 1900–1925; 1925–1950; 1950–1975; >1975 (Figure 4). The first and last periods are larger than 25 years since the law forcing people to be buried in cemeteries was only passed in 1844, taking a few years to be adopted, and the 21st century has marked a considerable change in the way Lisbon’s populations face death, with an extraordinary increase in cremations and a lower number of burials in recent years (Instituto Nacional de Estatística 2010). The tombs in each 25-year interval were chosen based on absolute and relative dating. For the absolute dating, we considered, when it existed, the date of the tomb’s construction or the dates inscribed in the epitaphs regarding the first person buried there. These are only 193 (26%) out of the 742 tombs. This means the remaining tombs had to be dated by construction sequence and style. According to the cemetery administration, the tombs with lower numbers were constructed before those with higher official numbers. However, even with lower numbers, some tombs had a more recent style, meaning that a new tomb had replaced the older one, keeping the original number. Thus, we had to date them based on their style as well. This final dating approach was made by looking at the dates inscribed in many different styles within the Ajuda cemetery, in other Lisbon public cemeteries with similar tombs, and in advertisements published in local newspapers from the 1850s to the 1980s (Monteiro 2022). This relative dating presented the same difficulty as any other dating by style method, mainly in the transition periods, where there is always some overlapping of styles; however, as an example, it would be impossible to create confusion between an 1875–1900 tomb style with another from the 1950–1975 period. Of these 742 tombs, as mentioned, 13 were considered, based on their size, location, and monumentality, to be distinguishable tombs.

Figure 4
Evolution periods of the tombstones (photos by authors).
Even if, as mentioned above, these spaces reflect the same organization as urban spaces with streets, crossroads, and buildings, while a city is an organic space that grows either orderly or disorderly and rarely has very defined boundaries, the same cannot be said about a 19th-century cemetery in Portugal. These were surrounded by closed, high walls, creating boundaries that separated the world of the living from the world of the dead, with access only through very well-defined doors. Since the limits of the Ajuda cemetery are clearly defined, this solves one of the most significant issues when defining any network, the definition of its boundaries (Peeples 2019).
3.2 The network
To build the network, we based our work on analogous approaches made by other researchers where the nodes were defined as road junctions and the road segments as edges (Crawford 2019; Poehler 2017). This choice was made since people, besides the necessity of visiting a shallow grave, always walk along the existing roads. Since the cemetery maintained the same internal organization from its construction until the 1940s, when a new area was added, we did not need to change the network’s configuration to do our initial calculations (Figure 1 right side).
Regarding the network measures, since we were investigating the places where people passed the most, the betweenness centrality measure (Borgatti 2005; Newman 2010) seemed the most adequate because it measures the number of times a particular node (road junction) is on the shortest path between any other road junction (Brughmans & Peeples 2023: 138). Simply put, it counts the number of times a person would pass on a certain road junction to arrive at any place in the network. See the formula below (example taken from Brughmans & Peeples 2023: 295)
xi = Betweenness centrality of node i (road junction i)
pjk ni = Number of shortest paths between nodes j and k passing through node i (i ≠ j or k)
pjk = Total number of shortest paths between nodes and j and k present in the network
However, although this formula can provide information about how people walked around cemeteries, we must consider two important situations. The first is about the intentionality that Katherine Crawford (2019) demonstrated regarding people’s movement, although in a different case (the city of Ostia). We should not consider that people walk around in places randomly. To overcome this, we considered that certain places create an attraction to people, influencing them to go near that place. We introduced the strength of the attraction concept in the network calculation by considering that the roads that most attracted people should be weighted higher.
The second situation is about the betweenness calculation. As mentioned above, in most closed public places, like the cemetery, people always enter from the same location, the door. To consider, as the betweenness coefficient does, that people can randomly start walking in every node (road junction) is incorrect. To overcome this, we only partially calculated the betweenness score, considering that people always start from a particular node (the door in our case). See formula:
xi = Betweenness centrality of node i (road junction i)
pdoork ni = Number of shortest paths between door and node k passing through node i (i ≠ door or k)
pdoork = total number of shortest paths between the door and node k present in the network
The visual representation of the network was made by changing the size of the nodes according to their centrality score. When calculating the betweenness score, larger nodes (big circles) have higher values, while the smaller nodes (small circles) present lower scores. The blue and its variations were also used to identify the differences in the betweenness values. The darker the node, the higher the betweenness score, while the lighter the node, the lower the score. On the maps, we used small squares for tomb representation. Pre-1900 tombs are shown in red squares and were designated with the letter B and a number for each tomb (or group of tombs), while post-1900 tombs are shown in light blue squares and were designated with the letter D and a number.
The next step would be to use the adapted betweenness score to test our hypothesis and understand whether the prominent tombs are located near the places with higher betweenness values.
3.3 Attraction
For this research, we defined 13 prominent tombs as those with characteristics that distinguished them from the main corpus of these small buildings. The characterization was based on aspects such as size, architectural features, and decorations, making them different from all the others. But what made them attractive? Was it just the architecture, size, and decoration, or was there something else? Their differences, as we will see, were some of the aspects that made them more attractive to people when visiting the cemetery because while some stand out over all the others, others are located in places that our network revealed to be of frequent passage, most likely influencing the decision for their location. Cemeteries were places where people went to mourn their dead. Still, they were also “museums of death”, attracting individuals to visit and observe these monuments to the deceased, among other intentions such as engaging in social relations. Contemporary newspapers of these funerary spaces reveal many different types of attractions these places held for people (Sousa 1994).
Defining what attracted people in the past is one of the most challenging things when constructing narratives about that past, and, as archaeologists, we will never be able to fully address ‘all potential forms of uncertainty’ (Brughmans & Peeples 2023: 187). Considering the difficulty of discussing attraction and how uncertain the results based on archaeological evidence are, in this paper, we suggest a theoretical proposal that we believe will open paths for future investigations. However, with the information we currently have, we can only partly demonstrate it mathematically. We are talking about the connection between accessibility and visibility (Turner et al. 2001: 115-116). Accessibility is about the places we can go and the routes we must physically take to arrive there (the edges in our paper). Visibility is about the places that people reach with their vision, regardless of whether they can reach them physically. In the Ajuda cemetery, this is fundamental to understanding people’s movement. Accessibility, unless we cut cross and step on recent graves, which is forbidden, is only possible by the road segments (our edges). However, it is possible to be attracted to tombs or other situations connected to us by lines of sight (a different edge, which, for future considerations, we named attraction edges). This way, when feeling attracted, we would be pushed to move toward a specific destination (a tomb in our case) that is in our line of sight, although using the previously mentioned roads (Figures 3 and 5), increasing the use of those same roads. The graves inside the blocks surrounded by the tombs do not have any impact regarding visibility and movement since they are shallow, thus not impacting the line of sight, but also because they are outside the roads where people have to walk.

Figure 5
Line of sight from door 2 looking into tomb D2.
This theoretical concept has a complexity that is not possible to overcome with the current lack of data. Still, in one specific case, we could mathematically calculate the attraction forces caused by looking towards certain tombs (lines of sight) and introduce that influence in the network calculations. This is a specific situation because the line of sight matches precisely with the roads, where both the accessibility and visibility edges, use the same route. This does not usually happen in other situations where people are attracted to monuments in a line of sight that does not match the road being followed. However, in this paper, other tombs will be theoretically presented as producing an attraction force towards them, which most probably influenced the way roads were used and the way road junctions were visited, although this is impossible to calculate owing to the lack of data.
Visibility is a common form of analysis in archaeology. However, ‘visibility network studies in archaeology are rare and employ a similarly limited range of network science techniques, often restricting the study to a network diagram representation that is explored visually’ (Brughmans & Brandes 2017: 3). We believe that by introducing into a pedestrian network the influence produced by the attraction toward a particular object (a tomb in our case) in the line of sight, we explore new paths in the use of visibility networks that must be deepened in future studies.
4. Results
The application of our methods started with an exploratory analysis of the network, characterizing it according to the usual betweenness centrality measure of the cemetery before the 1940 expansion (Figures 6). As we can see, most of the distinguishable tombs are positioned near road junctions with high betweenness scores. However, besides not explaining all the tombs’ positions, since there are tombs far from those road junctions with higher betweenness scores, there are road junctions with high scores without distinguishable tombs. This can be explained since, as mentioned above, the betweenness centrality measure in this situation is not entirely correct because to enter closed public spaces, you always use the same node (the door). Moreover, as we can see in Figure 7, a heatmap showing the cemetery occupation until 1875 (the first period of analysis), on the opposite side of the door, there was no occupation at all. So, it would not be correct to consider a betweenness calculation starting in the nodes that no one visited.
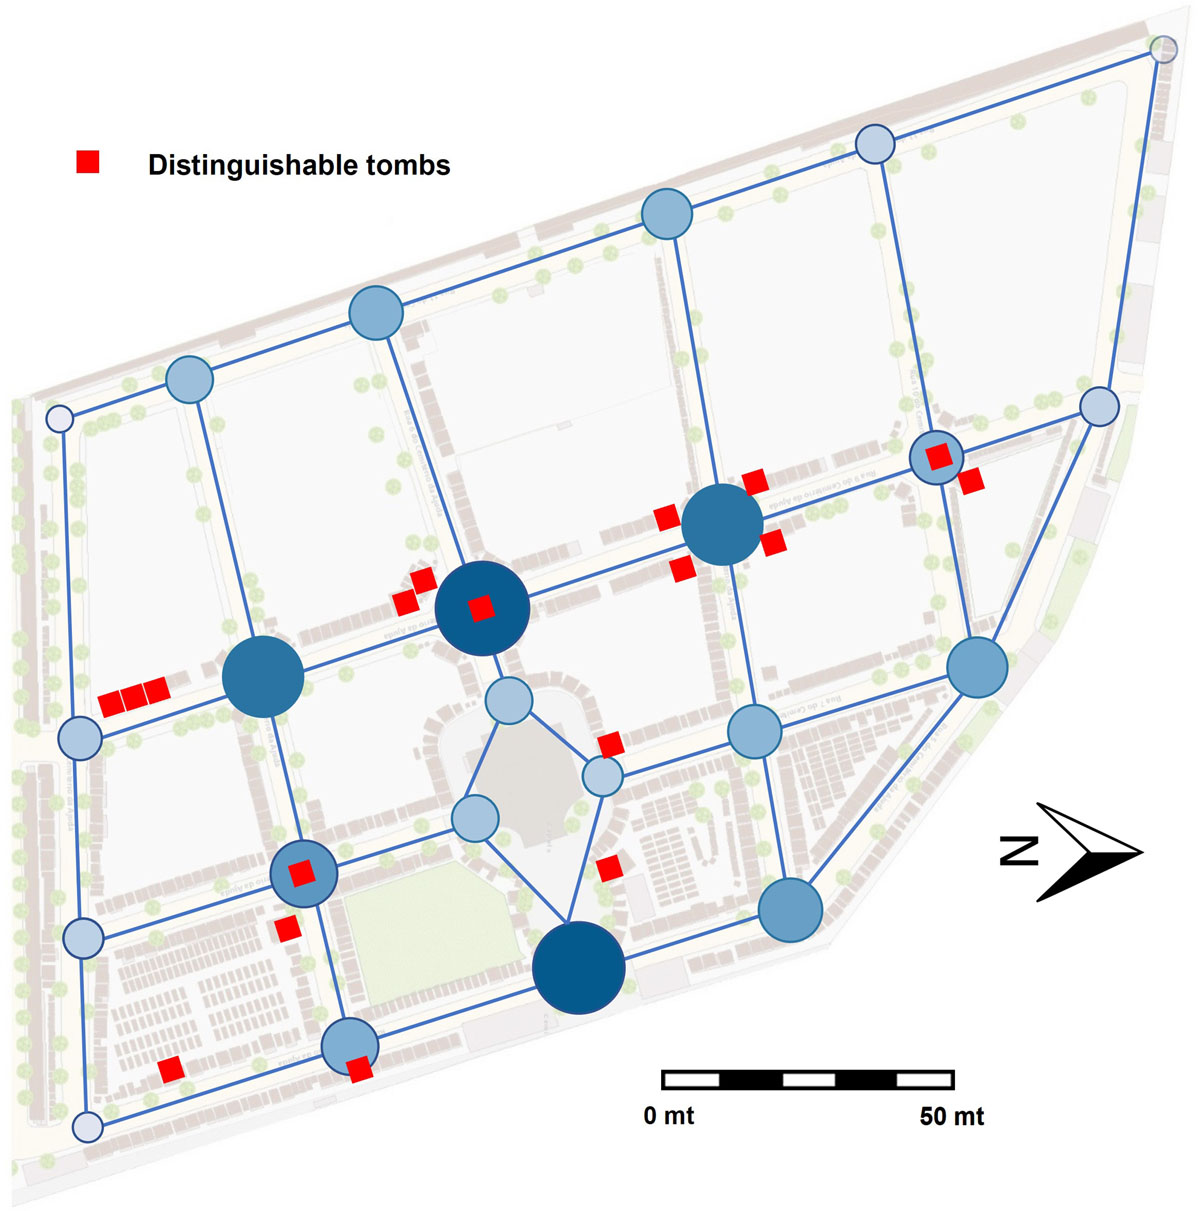
Figure 6
General Betweenness score of the 18th century part of the cemetery.
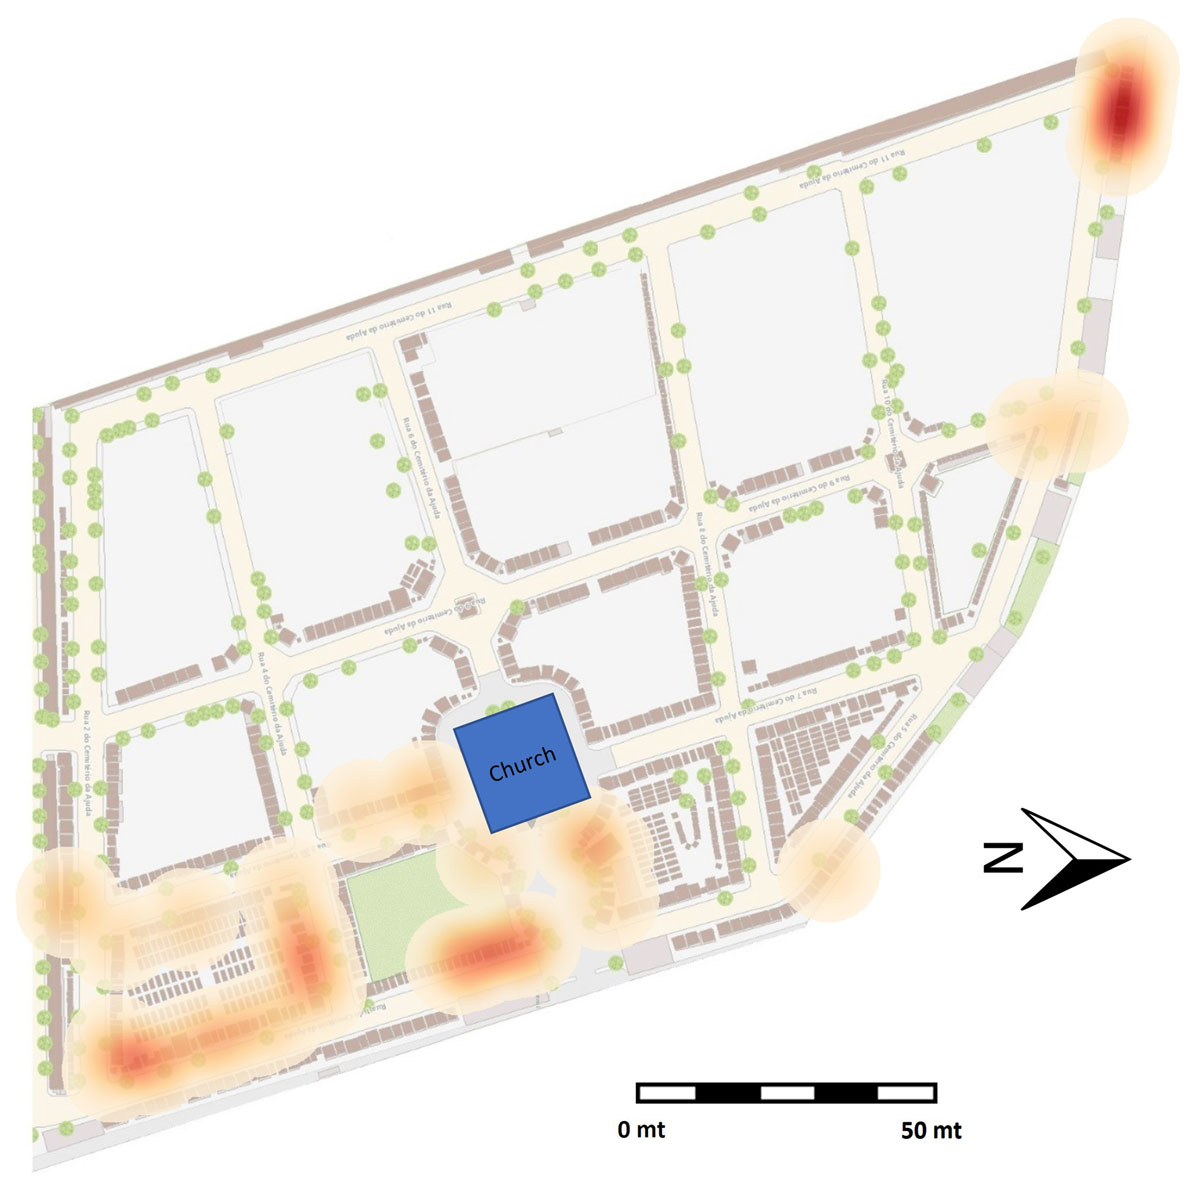
Figure 7
The 18th century part of Ajuda cemetery heat map with the tombs’ occupation in 1875.
Thus, the second step in the exploratory analysis was to calculate the betweenness score, considering that people always started their visit from the door (the biggest circle in Figure 8). As it is possible to verify, most of the previous high-scored road junctions now have low betweenness scores. However, if we view this chronologically, until 1900, no distinguishable tombs (light blue squares in Figure 8) were being built near those low-scored road junctions, which confirms the validity of proposing a different approach when calculating the betweenness score.

Figure 8
Betweenness score calculated from the node at door 1 (red squares – tombs until 1900; light blue squares – tombs after 1900).
The next stage was to try to understand why the pre-1900 distinguishable tombs (red squares) were positioned in certain areas (Figure 9). Besides being near road junctions with higher betweenness scores, where people passed most, to enhance our comprehension of their position we introduced the attraction force concept induced by the lines of sight. Let us consider the four distinguishable tombs in Figure 9 (B1 to B4), plus a group of tombs (B5) which, although not distinguishable, we will discuss for their strangeness.

Figure 9
Distinguishable tombs built before 1900.
B1, although it is a distinguishable tomb, we nowadays, only notice when we are close to it. It is surrounded by other funerary monuments that block the view if one is not nearby. To understand why it is located there, we must consider the moment when the tomb was built, since at that time it was the only one in that street and in line of sight with the entrance of the Ajuda cemetery (Figure 10). It is thus easy to imagine that, when entering the cemetery, people would immediately see that enormous tomb and feel attracted to seeing it.

Figure 10
Line of sight from the cemetery entrance to the distinguishable tombs pre-1900.
The second distinguishable tomb, B2, does not need any justification since it is positioned right in front of the cemetery entrance (Figure 10). It was the first big tomb to be built in the church alley, probably because an important noble family built it: the Restelo’s Counts. It was positioned in the road junction with the biggest betweenness score by far. Tomb B3, the third distinguishable tomb, was placed precisely between tomb B2 and the church (Figure 10). It is still in line of sight with the entrance today (Figures 10 and 12). Tomb B4, although positioned in a place with the second highest betweenness score (Figure 8), is not nowadays, in line of sight with the entrance, and so, as we mentioned for tomb B1, we need to go nearby to see it. However, as tomb B1 tomb B4 was also the first tomb in this area (Figure 9), and, when built, it was in line of sight with the entrance, it would have attracted people who came to visit the cemetery. Adding to this, tomb B4 was also built in front of a cross junction, becoming even more visible. These four tombs were not only located in places where people naturally passed more often (high betweenness scores), but their presence also influenced and enhanced the attraction of these places, possibly motivating the construction of new, smaller tombs. Curiously, these smaller tombs that were taking advantage of the significant monuments’ attraction were also diminishing that same attraction by erasing the visibility lines.
Finally, we have the group of tombs B5. They are in the most distant position from the entrance (Figure 10). Their presence in this area of the cemetery, a place where they are still isolated today, made us wonder if this was, in fact, their original place or whether, for any reason, they had been dislocated. An interview with the cemetery administration rapidly confirmed that this was, in fact, the final resting place of the people buried there since these are permanent tombs and, according to the law, cannot be dislocated. They are not big distinguishable tombs like the previous ones (B1 to B4); however, all of them date pre-1875 and are located in a part of the cemetery where nothing existed at the time (besides the roads), except for this group of 12 tombs, in a row. Their epitaphs reveal a detailed explanation of who was buried there, associated with typical mid-19th-century monuments. The question is why, with so much space to put a tomb anywhere before 1875 (Figure 7), would someone choose to put their graves in the outermost place, far away from the door? One possible hypothesis is the line of sight. When they started to be placed there – the first ones are dated before 1850 – no tombs were blocking the view (B2 and B3 were built later) (Figure 11), and anyone arriving at the cemetery would see that group of tombs. This way, they would be in a quiet place that would still be visible from the entrance. Of course, this does not entirely explain why they were precisely there, but it does not seem that these tombs were made to be hidden.

Figure 11
Line of sight from the cemetery entrance to the group of tombs B5, all of them dating pre-1875.
So until now, we have understood why the distinguishable tombs before 1900 were positioned in those places; but what about the distinguishable tombs post-1900? Why would someone put distinguishable tombs made to be seen in places that, unless you went there on purpose, nobody would see when entering the cemetery door? In Figure 12, it is possible to see that all the lines of sight at the entrance would be blocked by the church and the existing tombs.

Figure 12
1942 entrance of the cemetery with a view of monument B3.
The first distinguishable tomb positioned beyond the viewshed from the entrance was tomb D1 (Figure 13) in 1901. This was a special tomb because it was placed in the middle of a road junction, creating the first roundabout of the cemetery. However, besides some attraction provoked in people who would pass the church and be impressed by the new roundabout, it was not the best place if you wanted to be seen.
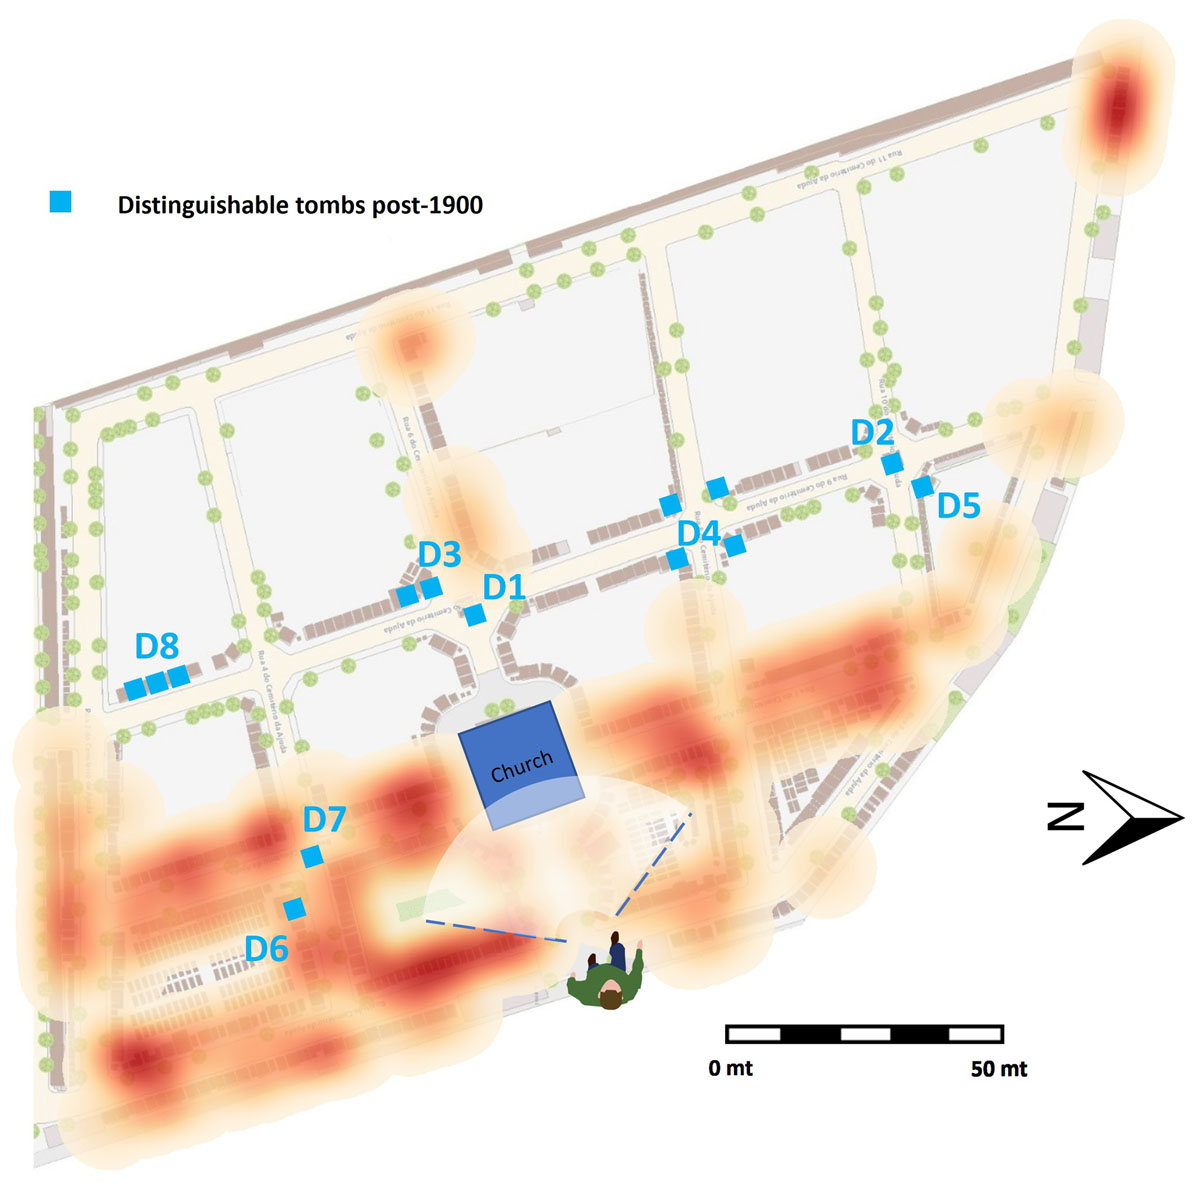
Figure 13
Heat map of the 18th-century part of the Ajuda cemetery with the tombs’ occupation before 1900 and with the viewshed from the entrance to the distinguishable tombs post-1900 (light blue squares).
Things changed completely around 1920. A second distinguishable tomb, D2 (Figure 13), was positioned in the middle of another road junction, creating a second roundabout. However, the construction of this tomb coincided with the opening of a second door (see door 2 in Figure 14). This new door completely changed the previous betweenness calculations because now people were entering from two different doors; people were starting their walks in two different nodes (door 1 and door 2).

Figure 14
Betweenness score calculated from both doors (door 1 and door 2) with the distinguishable tombs: red squares – tombs until 1900; light blue squares – tombs after 1900).
The new betweenness calculation was made by averaging the results of the two doors, but with a higher weight (60%) for door 1, since this was still the main door (Figure 14). To guarantee that these weights were robust, we did some robustness tests to the betweenness calculation, changing the weight of door1/door2 from 50/50 to 70/30. The results did not vary significantly.
However, another change was introduced in this new calculation, intended to include some effect regarding the visual attraction toward a certain place (distinct tombs in our case). When entering door 2, we can go either left, right or straight forward. We considered that the probability of going straight forward is ten times more likely than turning left or right, for two main reasons. First, the road is going down, and people prefer to go down. However, the main reason is the attraction produced by the new roundabout (Figure 5). It is impossible not to be attracted to that distinguishable tomb (D2) in the middle of the road. The final result is the betweenness calculation in Figure 14. Now it is understandable why people started to position distinguishable tombs on that new road, specifically the group of tombs D3, D4, and D5 (Figure 13). The likelihood that people would pass there and see those tombs was now much greater. As happened in the previous period (monuments B1–B4), the smaller tombs benefited from the attraction that bigger tombs held for people, and nowadays, the distinguishable tombs are surrounded by smaller ones.
Monuments D6 and D7 are curious cases of location associated with visibility. Why would someone put one distinguishable tomb, which the builders wanted people to see, in a place that could not be seen from the entrance (Figure 15)? To overcome this situation, they made it so high that it is still possible today to see it in a line of sight from the door (Figure 16). Making the most of this visibility, another distinguishable tomb (D7) was positioned just a few metres away from D6 (Figure 15), taking advantage of the fact that it was located near the highest monument in the cemetery. The place already had a very interesting betweenness score (Figure 14), which was most likely increased by the attraction created by tomb D6.
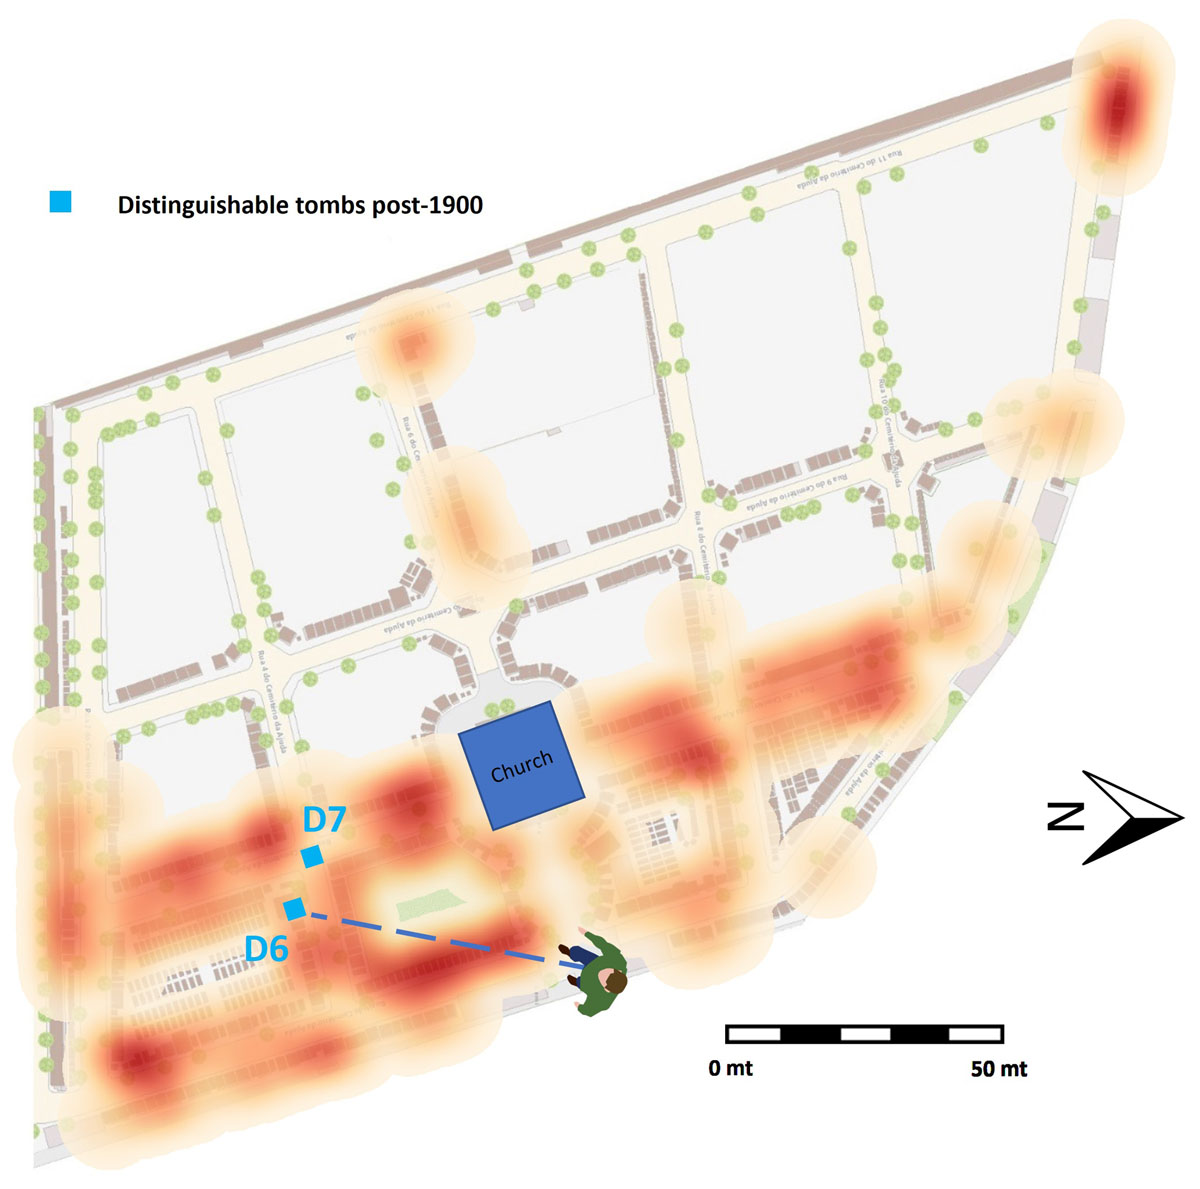
Figure 15
The 18th century part of Ajuda cemetery heat map with the tombs’ occupation pre-1900 with the line of sight for tomb D6.
Figure 16
Line of sight from the entrance to the tallest monument in the cemetery.
Finally, we have a group of distinguishable tombs (D8) (Figure 13) built in the last quarter of the 20th century. As we can see from Figure 14, these tombs are not positioned in a place with a high betweenness score and are not even in the line of sight with the entrance places. So, why there? We must introduce a new calculation for these tombs since, as previously mentioned at the end of the first half of the 20th century, a second area was added to the cemetery (Figure 1 left side). These were the only distinguishable tombs identified after adding this new area to the cemetery. Using the same logic for calculating the betweenness score starting from the two existing doors, the score was calculated using the two parts of the cemetery (Figure 17).

Figure 17
Betweenness score calculated for the entire cemetery with all the distinguishable tombs (red squares).
We can see that these large tombs are now located in an area that became a passage to the new part of the cemetery, having a high betweenness score. When entering the second door and intending to go to this new area, people would necessarily pass through this place. Although there is another road leading to this new area with high betweenness scores as well, by the 1940s, when the new area was added, all the available lots on this second road were already occupied.
5. Conclusion
The initial intention of this paper was to analyse how social behaviours in a Lisbon cemetery could be observed using a network theory that combined movement and visibility. After considering circulation paths and spaces as well as the monumentality of tombs, it was possible to conclude that distinguishable monuments, those belonging to upper social classes, tended to be placed in areas with the highest betweenness score, utilizing the places where people passed most to become even more visible. This same behaviour is observable in Lisbon, and while the houses orientated towards the street belong to wealthier families, the backyards are occupied by lower-income people (Reis et al. 2020), precisely as in cemeteries. In addition, large buildings, such as palaces are located in strategic areas of the city, making the most of their location in the landscape and creating attraction points (Casimiro & Boavida, in press). This happens so frequently that sometimes the streets are even known by the name of the house of someone important and not by the name of the street itself (Castro, Santos & Casimiro 2023). Despite this similar social behaviour, one must be aware that analysing circulation through a network theory in a closed space can never be done in the same way as in a city, especially because one is a closed space and the other an open one.
Places with the highest betweenness values, which in the case of the cemetery were calculated bearing in mind this is a confined space with specific entrances, were reinforced as important passage points by their visibility to the monumental tombs constructed there. These monuments were located in places of attraction increased by their presence since they started to work as a force of interest to the visitors, a similar behaviour to that which occurred in the city in relation to important buildings. This may be one of the reasons why distinguishable tombs tend to be surrounded by smaller, less distinguishable monuments that occupy that area, always built after the large ones were placed. However, as smaller tombs increased around the distinguishable ones, the latter tended to lose their prominence in the landscape. This may be one of the reasons why tomb D6 was built to be the highest building in Ajuda, a rank that still holds nowadays, almost 100 years after it was built. The increase in the number of smaller tombs surrounding the distinguishable ones made the architects believe that monumentality was based not only on size but also on how tall they were.
This relates directly to what we call attraction edges, or how visibility can somehow influence the choice of a path toward a monument when we cannot access it in a straight line. Although we are not yet capable of mathematically calculating this concept, except when visibility coincides with accessibility, we have started this debate to discuss how the concept of attraction, coming from visibility, can be connected to movement networks, when pedestrian routes must be respected.
We started this paper with what was believed to be ‘centering relational thinking, relational questions, and relational theories’ (Brughmans & Peeples 2023: 270). We applied a network model based on centrality measures of a movement and visibility network to address how a 19th-century cemetery could reflect social behaviours. Although believing that question was addressed, we also have learned that there are methods, such as determining the impact of visibility attraction in a movement network, that we were not able to calculate and have just presented theoretically owing to the lack of data. This seems to reveal that the application of network models still has a lot of space to grow when answering challenges from past social and cultural actions.
Software
Heatmaps were created in QGISv3.22.7 using the pre-existing QGIS processes (‘qgis:heatmapkerneldensityestimation’). All the network constructions and analysis (betweenness calculation and its adaptation) were done in Gephi 0.9.7.
Reproducibility
All data (inventory and photographs) is stored with the authors and available upon request.
Notes
[1] All maps were taken from the site Lisboa Interactiva a free open resource: https://websig.cm-lisboa.pt/MuniSIG/visualizador/index.html?viewer=LxInterativa.LXi [12/5/2023].
Acknowledgements
We would like to thank the Lisbon Historical Archives for the use of pictures and to all their staff when we did our research. To the Ajuda employees for their good mood and help, thank you.
Funding Information
Tânia Casimiro is funded by FCT by the project [DL57/2016/CP1453/CT0084].
Competing Interests
The authors have no competing interests to declare.