
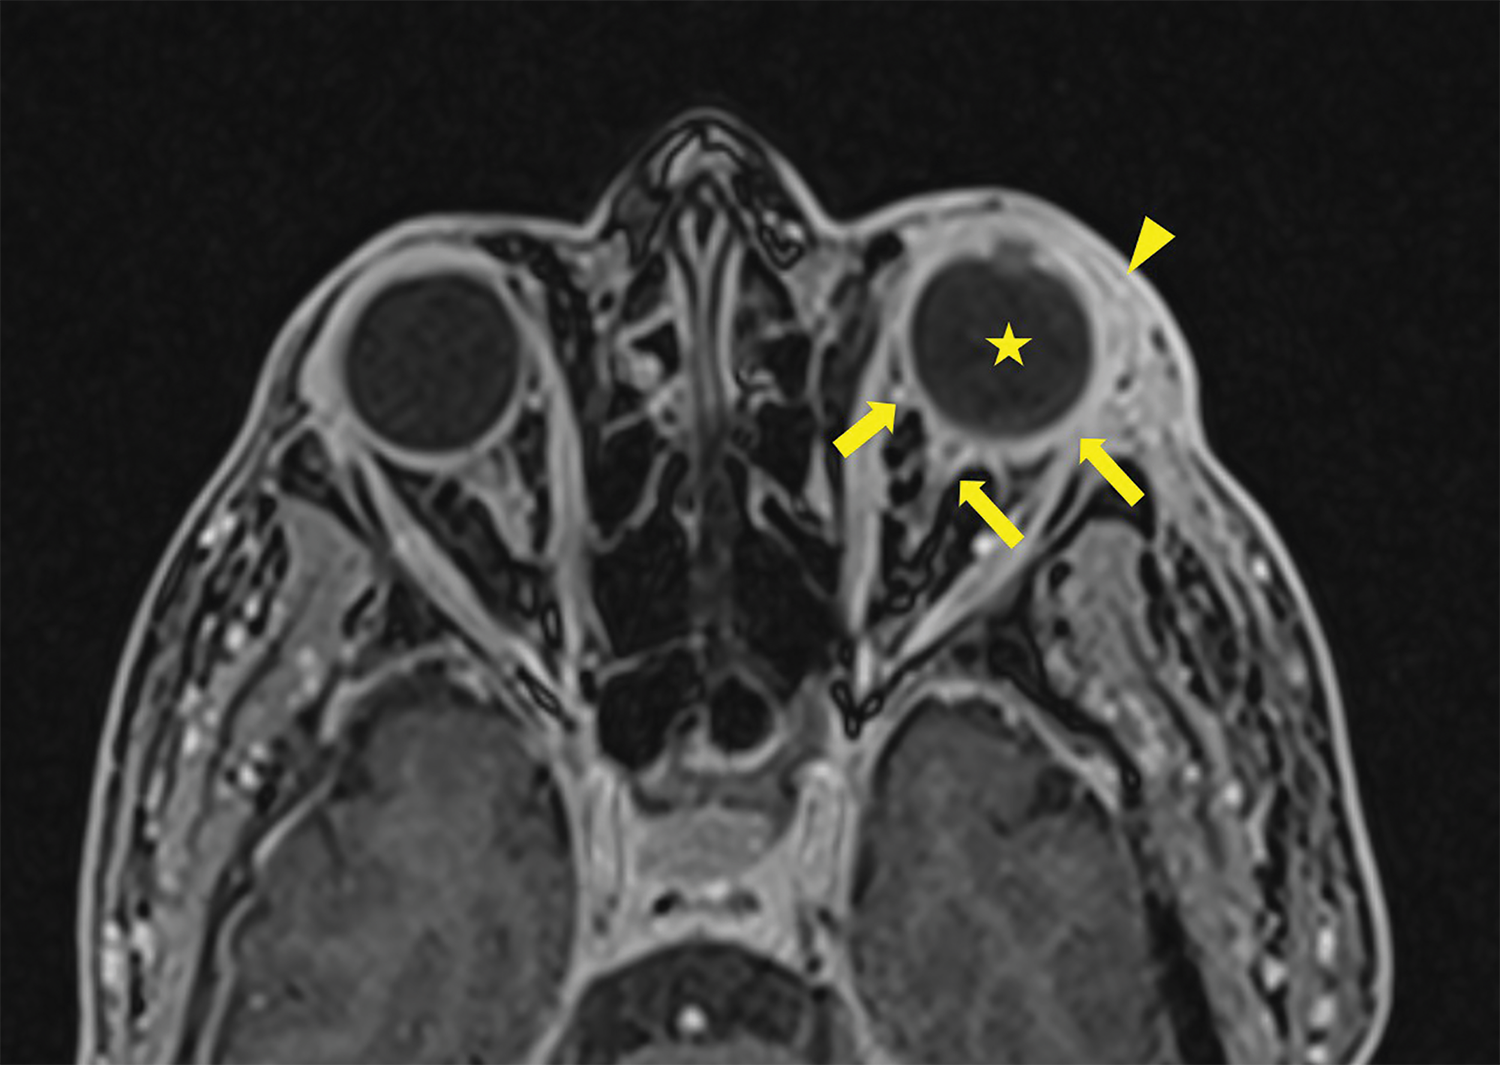
Figure 1
3D T1 Dixon Sequence showing pre‑septal enhancement (arrowhead) with an increase of the sclera enhancement as well as the junction between the left ocular globe and the optic nerve (arrows). Note the slight increase in T1 signal of the vitreous body (star).
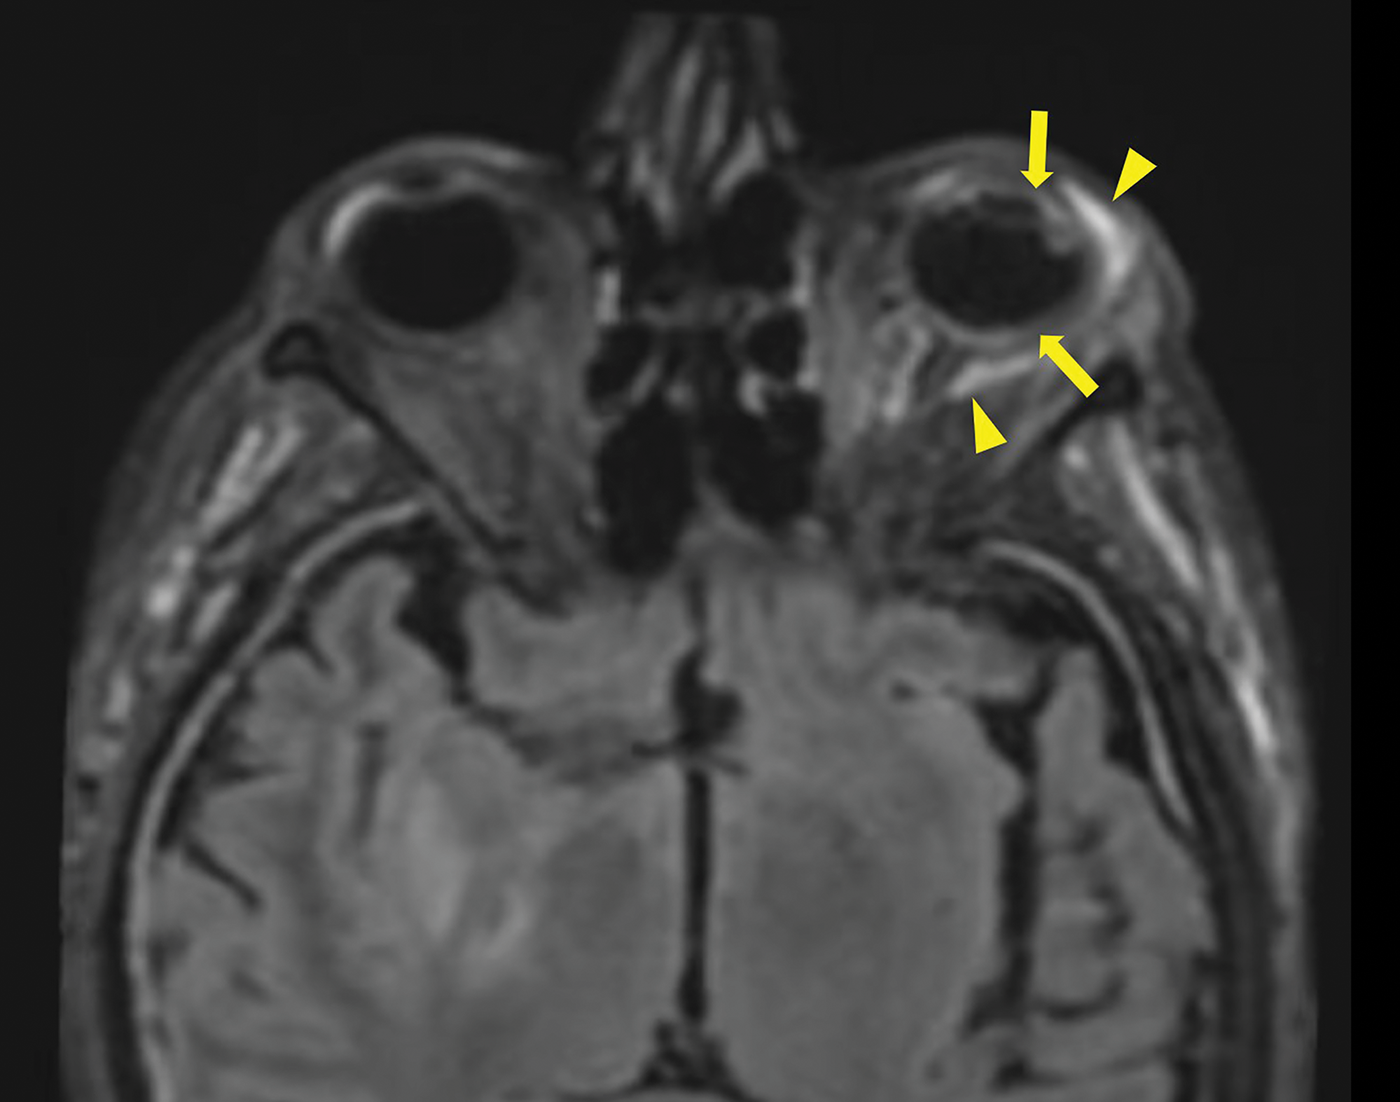
Figure 2
3D FLAIR Sequence with Fat saturation post contrast injection showing a pre‑septal and a perioptic hypersignal (arrowheads), a increase signal of the choroid and of the ciliary body. Also note the thickened dura mater in relation to the meningitis.
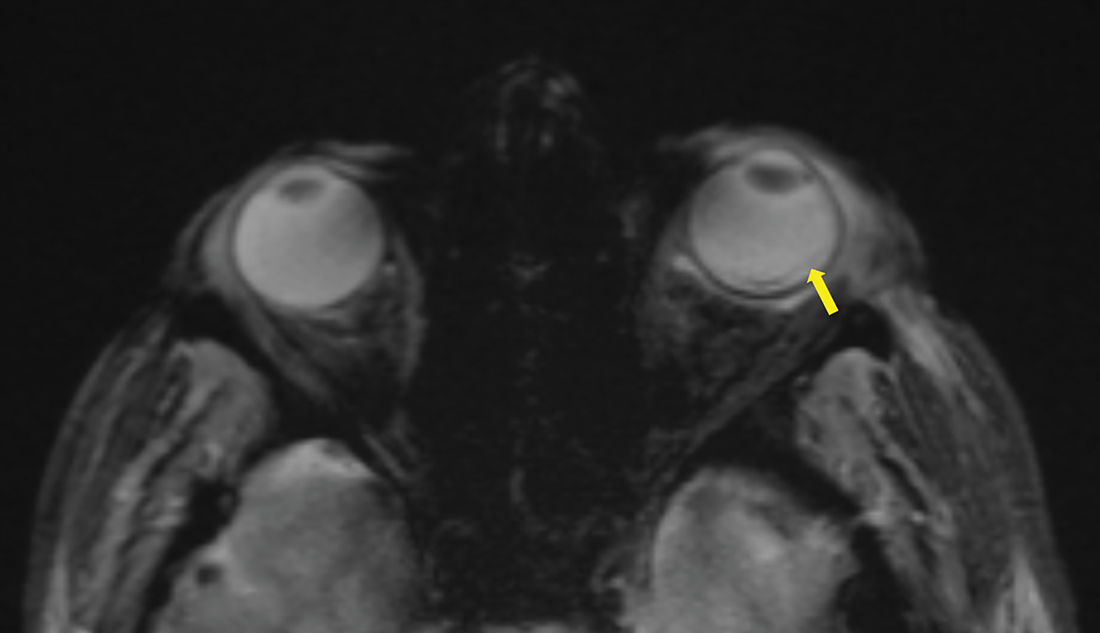
Figure 3
Axial T2 gradient echo sequence showing a retinal detachment with a slight linear hypoT2 signal (arrow).