
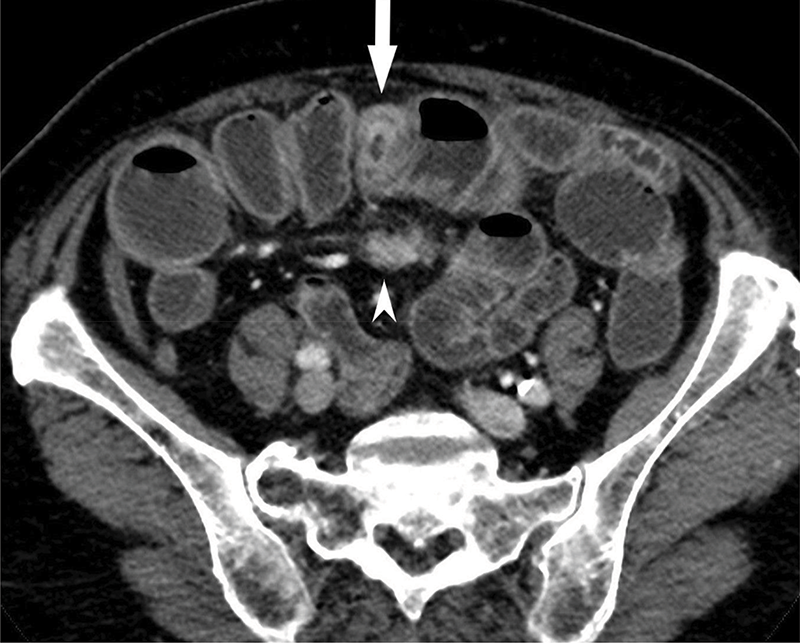
Figure 1a
CT showing contrast‑enhancing ileal NET (arrow) and mesenteric mass (arrowhead).
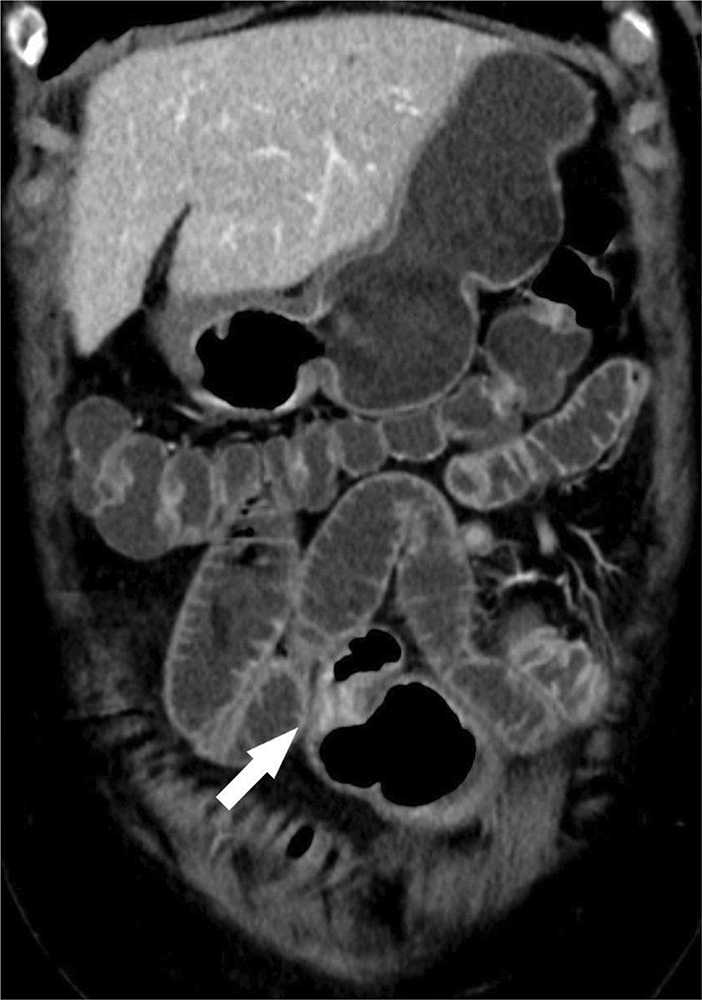
Figure 1b
CT showing stenotic ileal loop with marked contrast‑enhancing wall thickening.

Figure 1c
Mesenteric mass with perilesional soft tissue strands indicating demoplastic reaction.
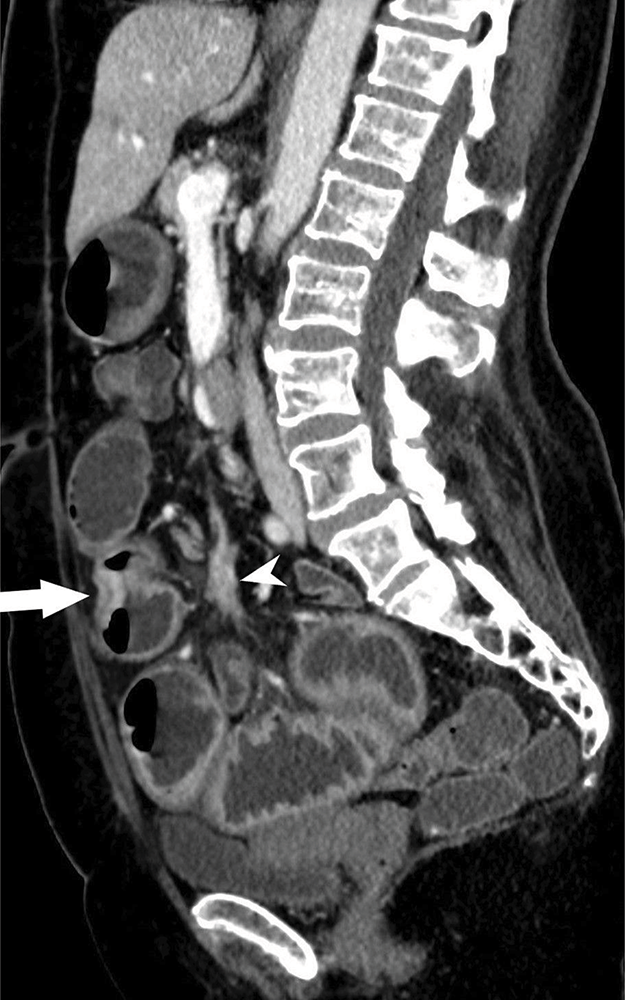
Figure 1d
CT demonstrating stenotic ileal NET with adjacent mesenteric mass.