
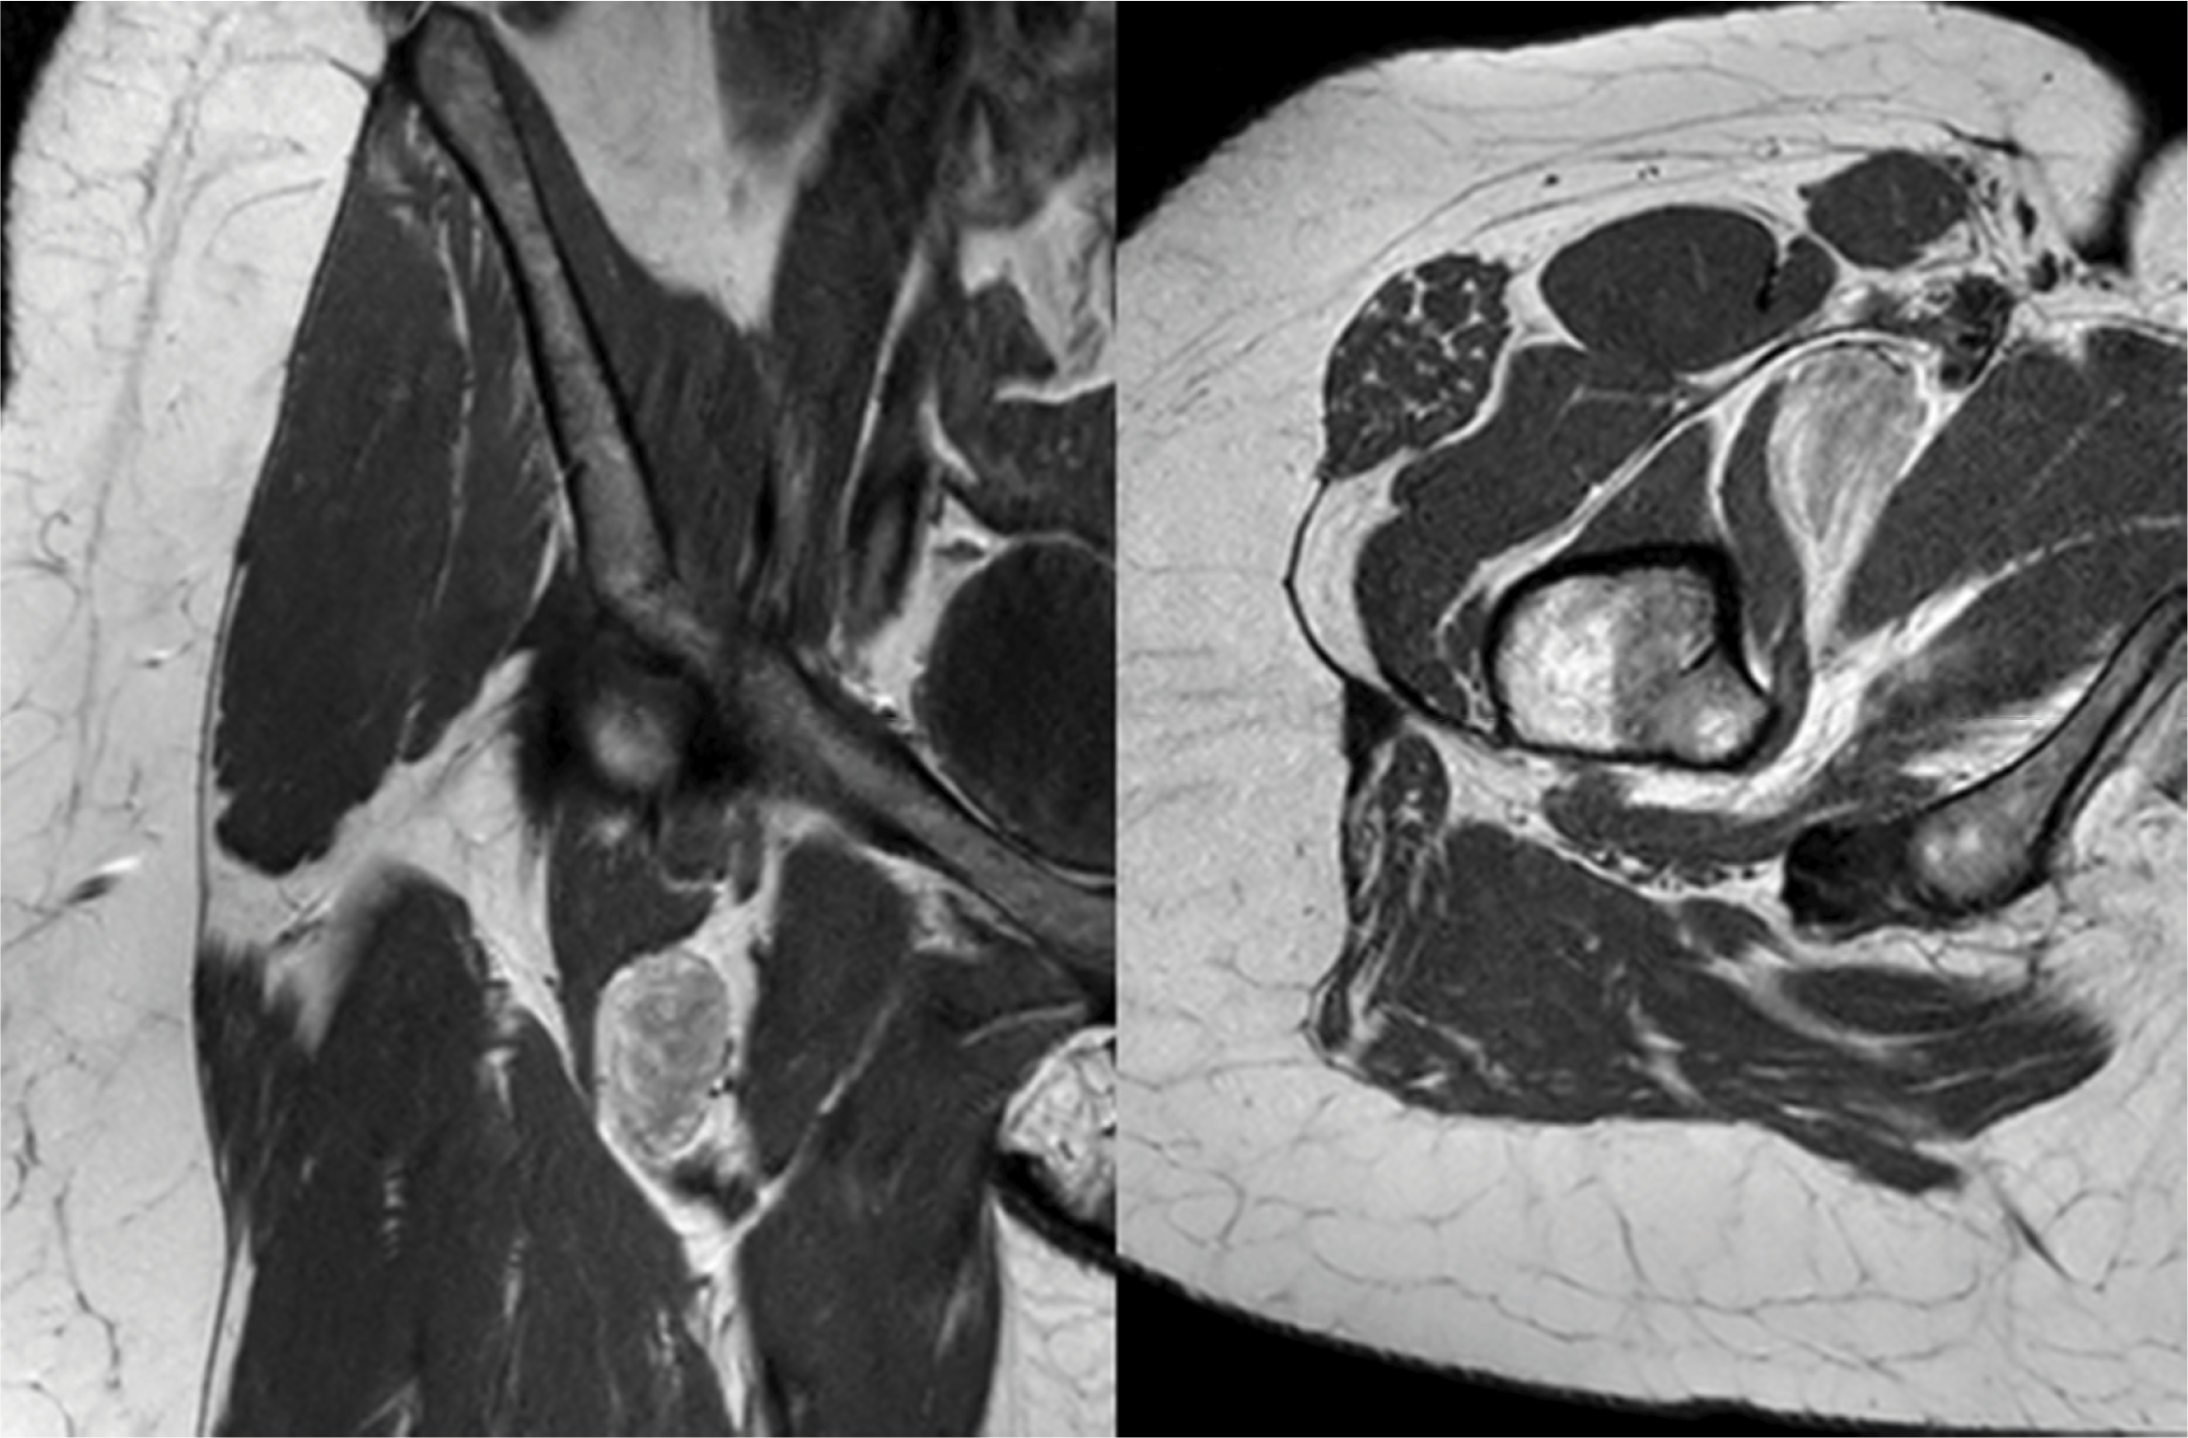
Figure 1
Coronal and axial T1 weighted MRI images revealed a well‑circumscribed mass in the deep right inguinal region with mixed signal intensities.
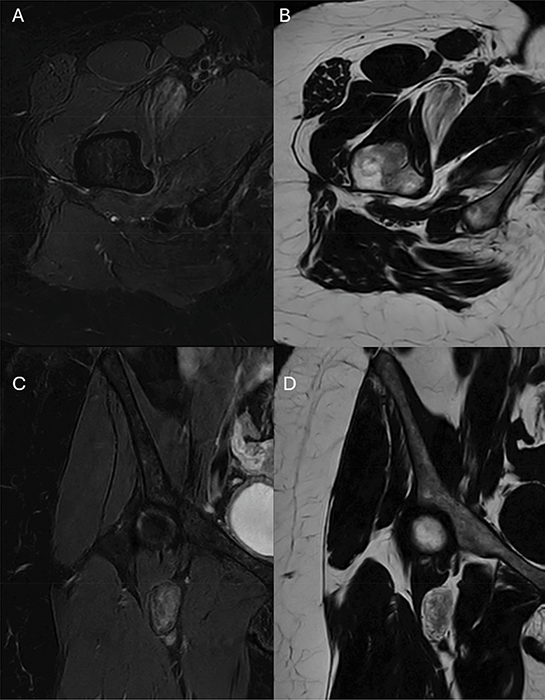
Figure 2
T2 Dixon MRI images demostrate the regions of high signal on the fat‑only images (B and D) corresponding to low signal on the water‑only images (A and C) with interspersed brush‑stroke‑like areas of high signal intensity on the water‑only images and low signal on the fat‑only images.
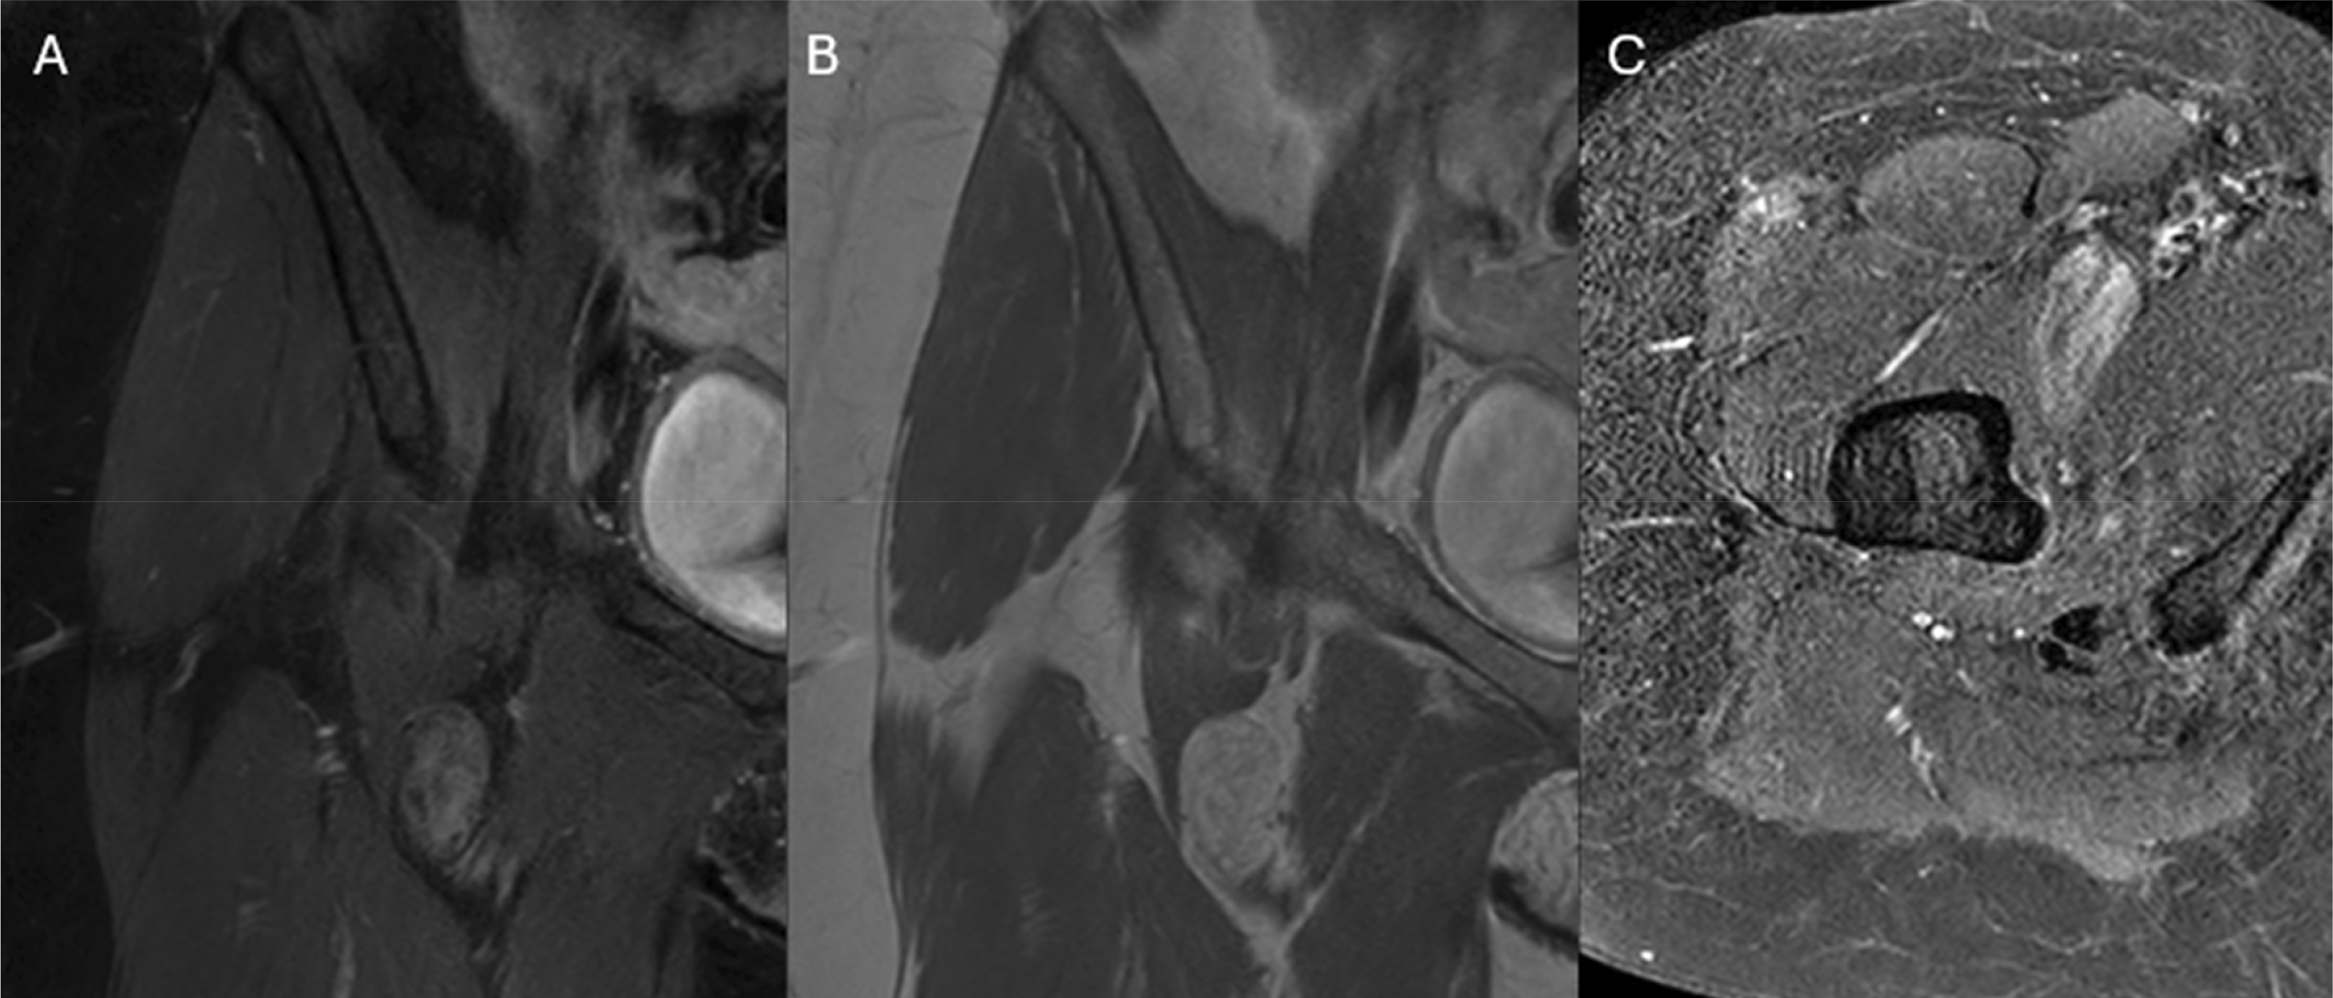
Figure 3
Coronal post‑contrast enhanced images (A and B) and axial post‑contrast SPIR images demonstrate enhancement of the regions of low fat‑content.