
Table 1
Patient demographics.
| DEMOGRAPHIC PARAMETER | GROUP 1 (N = 56) | GROUP 2 (N = 11) | GROUP 3 (N = 13) | TOTAL (N = 80) |
|---|---|---|---|---|
| Sex: men | 44 (79%) | 6 (55%) | 7 (54%) | 57 (71%) |
| Age | 71 (std 11.2) | 70 (std 11.7) | 64 (std 12.1) | 69.6 (std 69.6) |
| Weight (kg) | 78.1 (std 15.1) | 78.3 (std 15.6) | 71.9 (std 17.4) | 77.1 (std 15.5) |
| Height (cm) | 173 (std 7.9) | 166 (std 9.2) | 171 (std 6.7) | 171 (std 8.1) |
| HR (bmp) | 73 (std 14.6) | 75 (std 11.1) | 74 (std 15.4) | 73 (std 14.2) |
| Indication for CTA: | ||||
| Infrarenal AAA | 23 | 5 | 3 | 31 |
| Iuxtarenal AAA | 1 | 1 | ||
| TAAA | 16 | 3 | 19 | |
| TBAD | 7 | 1 | 2 | 10 |
| TAAD | 5 | 3 | 8 | |
| Aortic stenosis | 2 | 1 | 1 | 4 |
| PAU | 1 | 1 | ||
| IAID | 1 | 1 | ||
| CIAA | 1 | 1 | 1 | 3 |
| Celiac trunk dissection | 1 | 1 | ||
| Renal artery aneurysm | 1 | 1 | ||
[i] kg: kilogram
[ii] cm: centimeter
[iii] HR: heart rate
[iv] bmp: beats per minute
[v] AAA: abdominal aortic aneurysm
[vi] TAAA: thoraco‑abdominal aortic aneurysm
[vii] TBAD: type‑B aortic dissection
[viii] TAAD: type A aortic dissection
[ix] PAU: penetrating aortic ulcer
[x] IAID: iatrogenic aorti‑iliac dissection
[xi] CIAA: common iliac artery aneurysm
Table 2
Calculated doses of injected contrast medium.
| CONTRAST DOSE | GROUP 1 | GROUP 2 | GROUP 3 | TOTAL |
|---|---|---|---|---|
| iCalc (ml) | 92 (std 18) | 93 (std 21) | 89 (16) | 92 (std 18) |
| Total injected dose | 46 (std 9) | 28 (std 10) | 35 (std 6) | 42 (std 11) |
[i] ml: milliliter
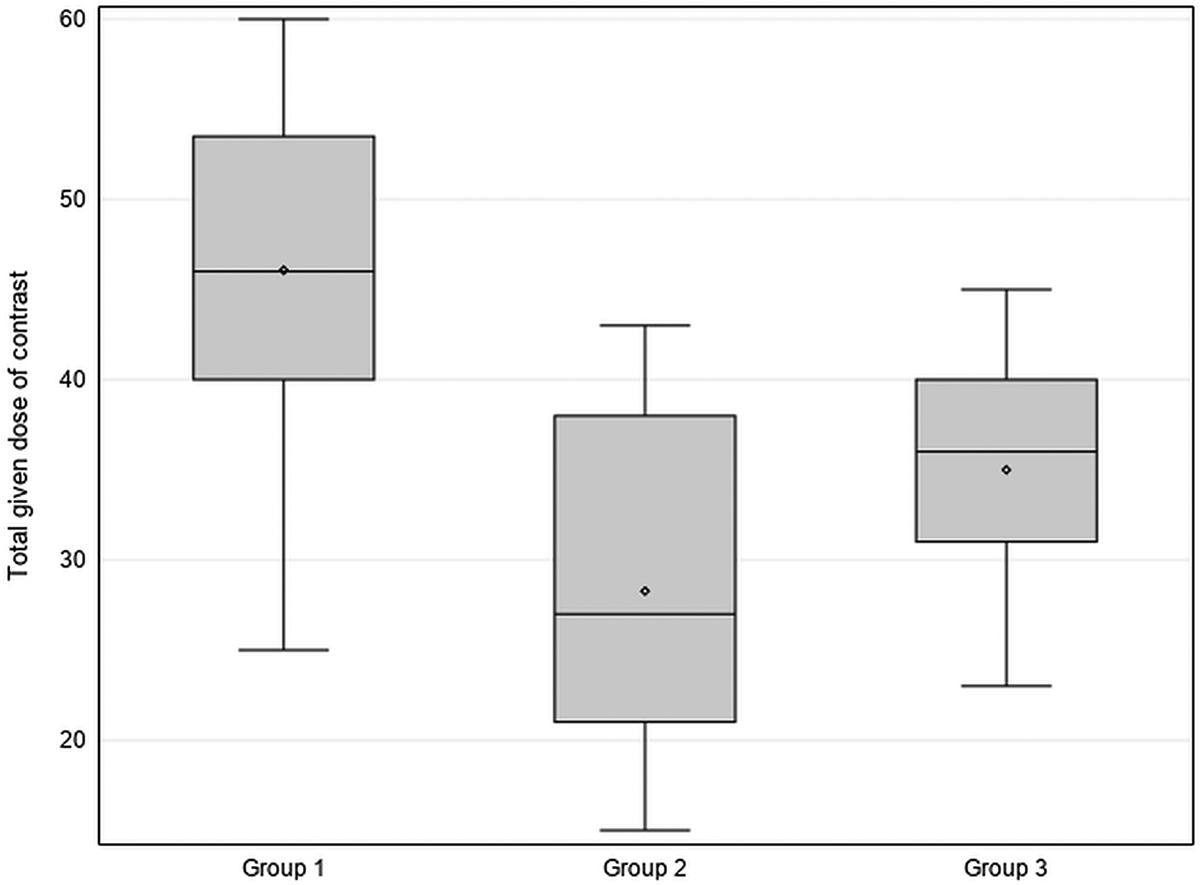
Figure 1
Box plot of mean total injected contrast dose per study group.
A significant difference between Groups 1 and 2 (P < 0.001) and between Groups 1 and 3 (P < 0.001) is found. No clear difference in between the injected contrast dose between Groups 2 and 3 is demonstrated (P = 0.072).
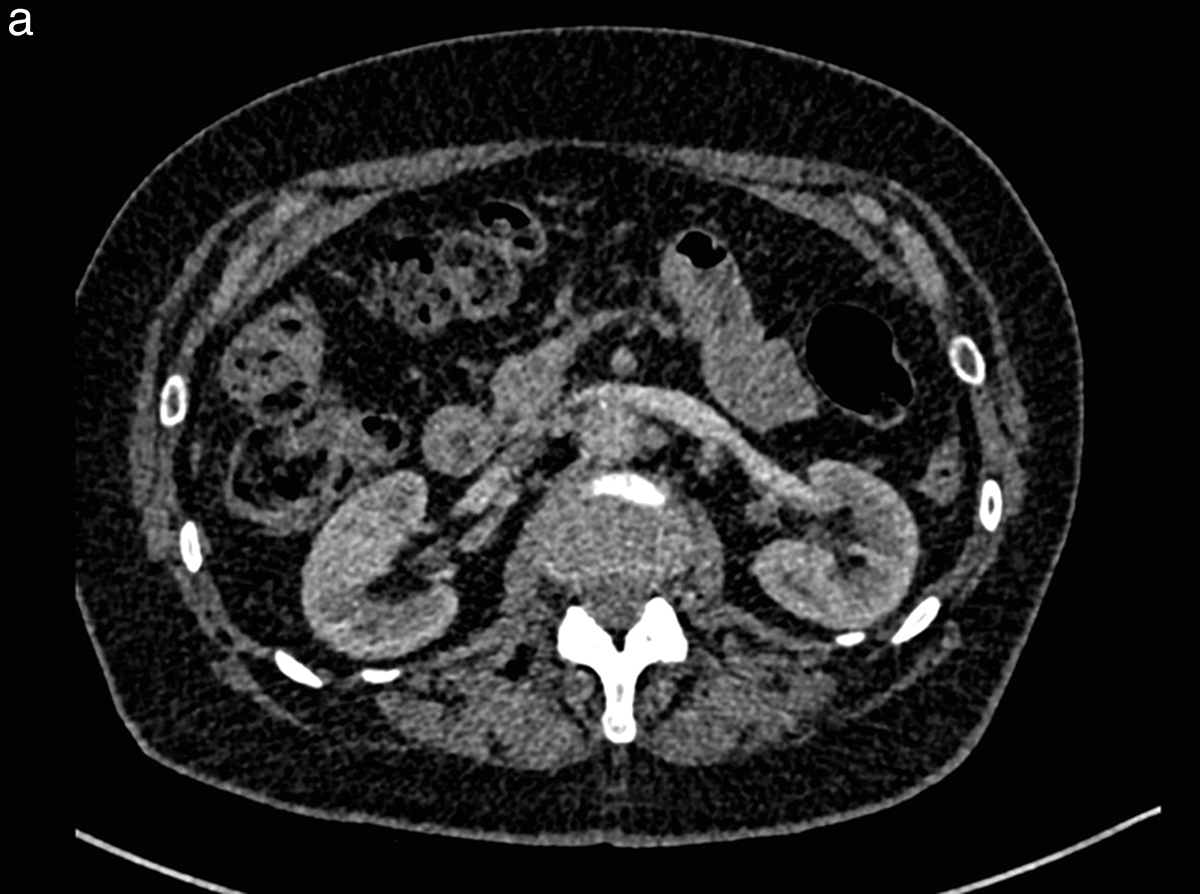
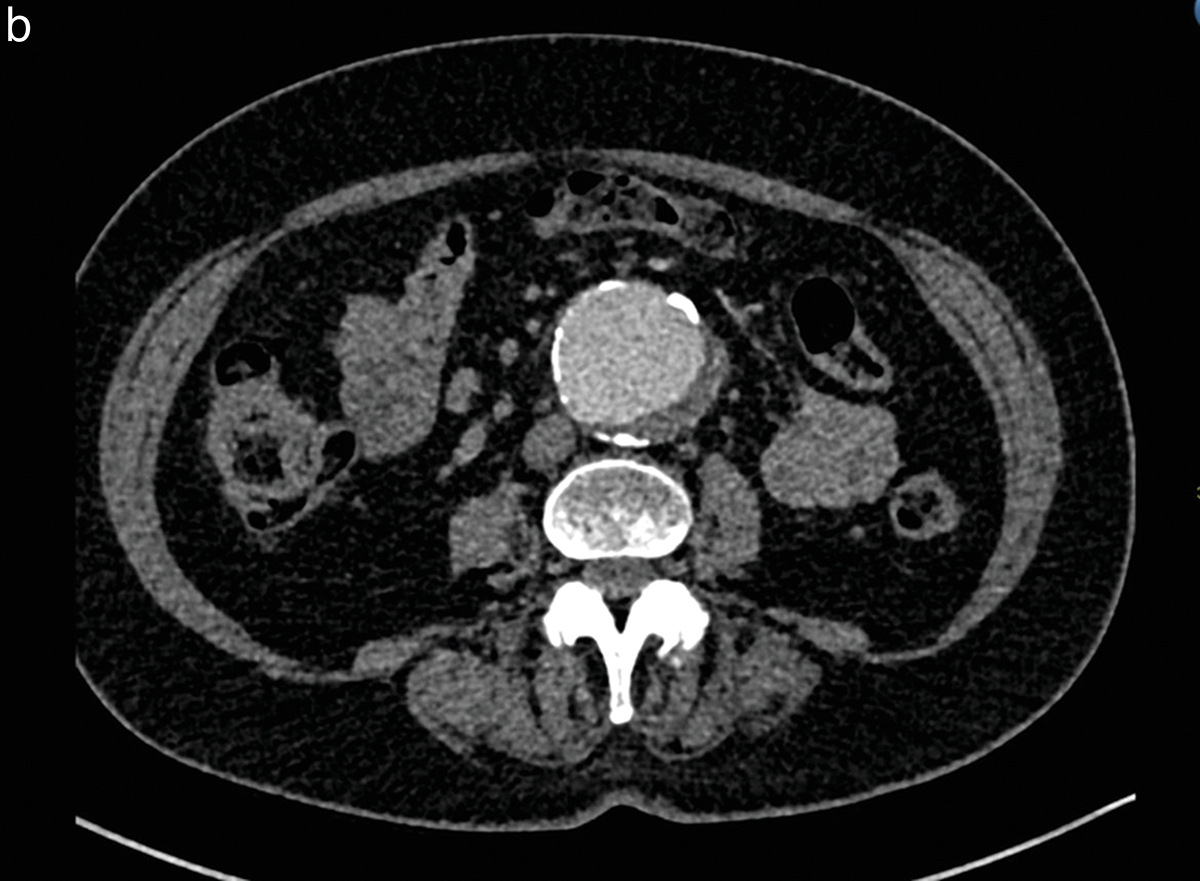
Figure 2 (a, b)
Patient with an abdominal aortic aneurysm, included in study Group 2.
After intravenous injection of 15 cc of iodinated contrast medium, the qualitative imaging score was 2 by the two independent observers for the axial slice at the renal artery level (a) and was 3 at the infrarenal level (b).
Table 3
Quantitative image analysis of mean pixel values (in Hounsfield units) from ROIs in different anatomical regions.
| ANATOMIC SEGMENT OF THE AORTA | GROUP 1 | GROUP 2 | GROUP 3 | TOTAL |
|---|---|---|---|---|
| Suprarenal aorta | 345 (std 101) | 191 (std 83) | 268 (std 87) | 311 (std 110) |
| Renal aorta | 342 (std 101) | 193 (std 78) | 263 (std 81) | 309 (std 109) |
| Infrarenal aorta | 350 (std 100) | 203 (std 83) | 254 (std 80) | 314 (std 109) |
| Left common iliac artery | 352 (std 98) | 197 (std 76) | 248 (std 81) | 316 (std 110) |
| Right common iliac artery | 342 (std 96) | 195 (std 85) | 237 (std 85) | 306 (std 108) |
Table 4
Linear correlation coefficient between the total administered dose and Hounsfield units measured at different levels of the aorto‑iliac region.
| ANATOMIC REGION | RHO | 95% CI | P‑VALUE |
|---|---|---|---|
| GROUP 1 (56 PATIENTS) | |||
| Suprarenal aorta | 0.353 | (0.096; 0.561) | 0.0073 |
| Renal aorta | 0.424 | (0.178; 0.616) | 0.0010 |
| Infrarenal aorta | 0.354 | (0.097; 0.562) | 0.0071 |
| Left CIA | 0.218 | (−0.049; 0.454) | 0.1060 |
| Right CIA | 0.217 | (−0.051; 0.452) | 0.1090 |
| GROUP 2 (11 PATIENTS) | |||
| Suprarenal aorta | 0.765 | (0.271; 0.931) | 0.0043 |
| Renal aorta | 0.729 | (0.195; 0.919) | 0.0088 |
| Infrarenal aorta | 0.706 | (0.150; 0.912) | 0.0129 |
| Left CIA | 0.699 | (0.086; 0.917) | 0.0220 |
| Right CIA | 0.711 | (0.109; 0.920) | 0.0186 |
| GROUP 3 (13 PATIENTS) | |||
| Suprarenal aorta | 0.493 | (−0.100; 0.814) | 0.0876 |
| Renal aorta | 0.433 | (−0.173; 0.787) | 0.1432 |
| Infrarenal aorta | 0.342 | (−0.271; 0.745) | 0.2604 |
| Left CIA | 0.460 | (−0.141; 0.800) | 0.1158 |
| Right CIA | 0.521 | (−0.064; 0.826) | 0.0679 |
[i] CI: confidence interval
Table 5
Qualitative images scores.
| VISUAL SCORE | GROUP 1 | GROUP 2 | GROUP 3 | TOTAL |
|---|---|---|---|---|
| INVESTIGATOR 1 | ||||
| 1 | 1/56 (1.8%) | 4/11 (36.4%) | 1/13 (7.7%) | 6/80 (7.5%) |
| 2 | 3/56 (5.4%) | 0/11 (0%) | 3/13 (23.1%) | 6/80 (7.5%) |
| 3 | 5/56 (8.9%) | 4/11 (36.4%) | 0/13 (0%) | 9/80 (11.2%) |
| 4 | 17/56 (30.4%) | 3/11 (27.3%) | 6/13 (46.1%) | 26/80 (32.5%) |
| 5 | 30/56 (53.6%) | 0/11 (0%) | 3/13 (23.1%) | 33/80 (41.2%) |
| INVESTIGATOR 2 | ||||
| 1 | 1/56 (1.8%) | 2/11 (18.2%) | 2/13 (15.4%) | 5/80 (6.2%) |
| 2 | 1/56 (1.8%) | 2/11 (18.2%) | 2/13 (15.4%) | 5/80 (6.2%) |
| 3 | 3/56 (9.1%) | 1/11 (9.1%) | 0/13 (0%) | 4/80 (5.0%) |
| 4 | 21/56 (37.5%) | 5/11 (45.4%) | 7/13 (53.8%) | 33/80 (41.2%) |
| 5 | 30/56 (53.6%) | 1/11 (9.1%) | 2/13 (15.4%) | 33/80 (41.2%) |
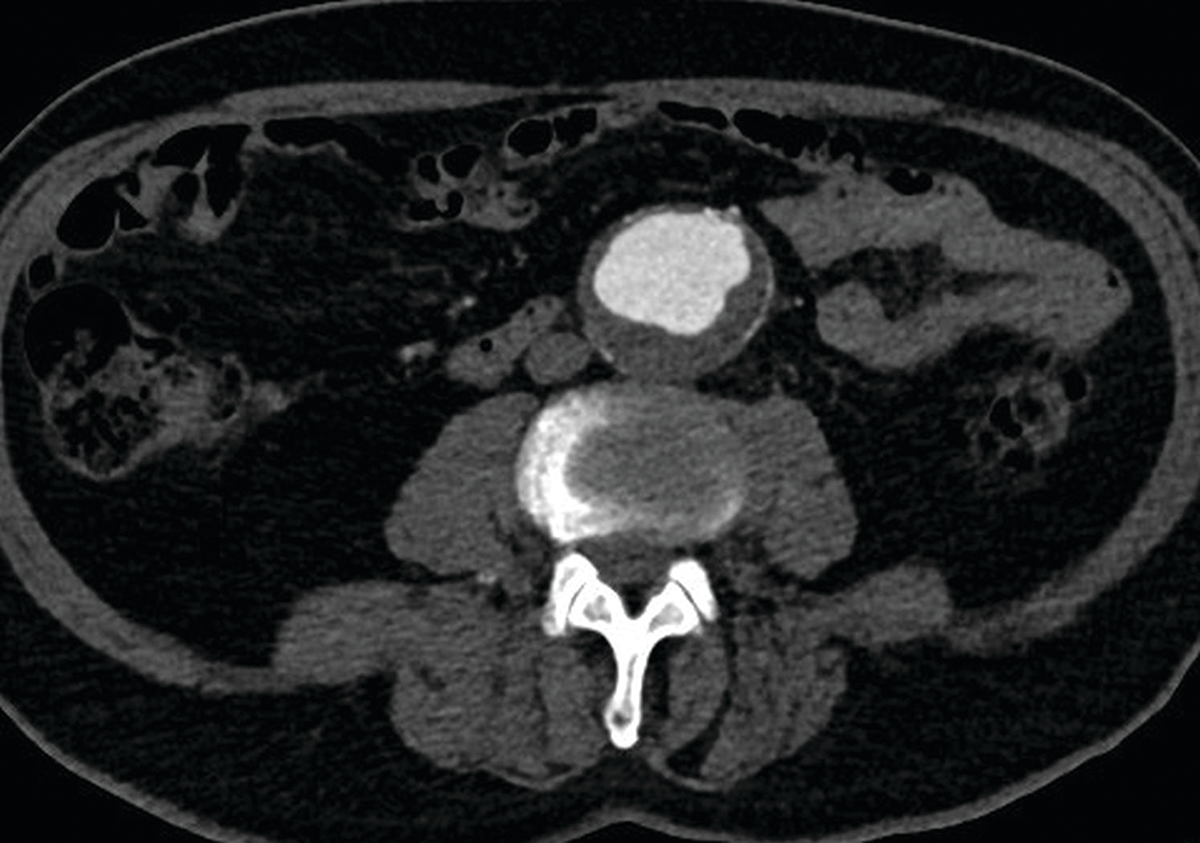
Figure 3
Patient with an infrarenal aortic aneurysm, included in study Group 3.
After intravenous injection of 38 cc of iodinated contrast medium (with 9 cc physiologic saline), the qualitative score was 5 by the two independent observers. The quantitative score was 372 Hounsfield units at the level of the abdominal aortic aneurysm.
Table 6
Relationship between the total amount of administered contrast dose and the qualitative scores adjudicated at different levels of the aorto‑iliac region.
| ANATOMIC REGION | RHO | 95% CI | P‑VALUE |
|---|---|---|---|
| GROUP 1 (56 PATIENTS) | |||
| Suprarenal aorta | 0.818 | (0.703; 0.888) | <0.0001 |
| Renal aorta | 0.859 | (0.766; 0.914) | <0.0001 |
| Infrarenal aorta | 0.815 | (0.699; 0.886) | <0.0001 |
| Left CIA | 0.717 | (0.554; 0.822) | <0.0001 |
| Right CIA | 0.750 | (0.602; 0.844) | <0.0001 |
| GROUP 2 (11 PATIENTS) | |||
| Suprarenal aorta | 0.924 | (0.704; 0.979) | <0.0001 |
| Renal aorta | 0.942 | (0.769; 0.984) | <0.0001 |
| Infrarenal aorta | 0.929 | (0.720; 0.980) | <0.0001 |
| Left CIA | 0.988 | (0.942; 0.997) | <0.0001 |
| Right CIA | 0.988 | (0.942; 0.997) | <0.0001 |
| GROUP 3 (13 PATIENTS) | |||
| Suprarenal aorta | 0.728 | (0.268; 0.908) | <0.0035 |
| Renal aorta | 0.661 | (0.146; 0.882) | <0.0120 |
| Infrarenal aorta | 0.725 | (0.262; 0.907) | <0.0037 |
| Left CIA | 0.882 | (0.623; 0.962) | <0.0001 |
| Right CIA | 0.780 | (0.375; 0.927) | 0.0009 |
[i] CI: confidence interval
[ii] CIA: common iliac artery
Table 7
Interobserver agreement analysis.
| GROUP | PROPORTION OF AGREEMENT (95% CI) | WK COEFFICIENT | P‑VALUE |
|---|---|---|---|
| Group 1 | 0.750 (0.622; 0.846) | 0.577 (0.384; 0.770) | <0.001 |
| Group 2 | 0.455 (0.213; 0.720) | 0.282 (−0.059; 0.624) | 0.0526 |
| Group 3 | 0.692 (0.420; 0.876) | 0.576 (0.238; 0.914) | 0.0004 |
[i] CI: confidence interval
[ii] WK coefficient: weighted Kappa coefficient, Kappa (95% CI)