
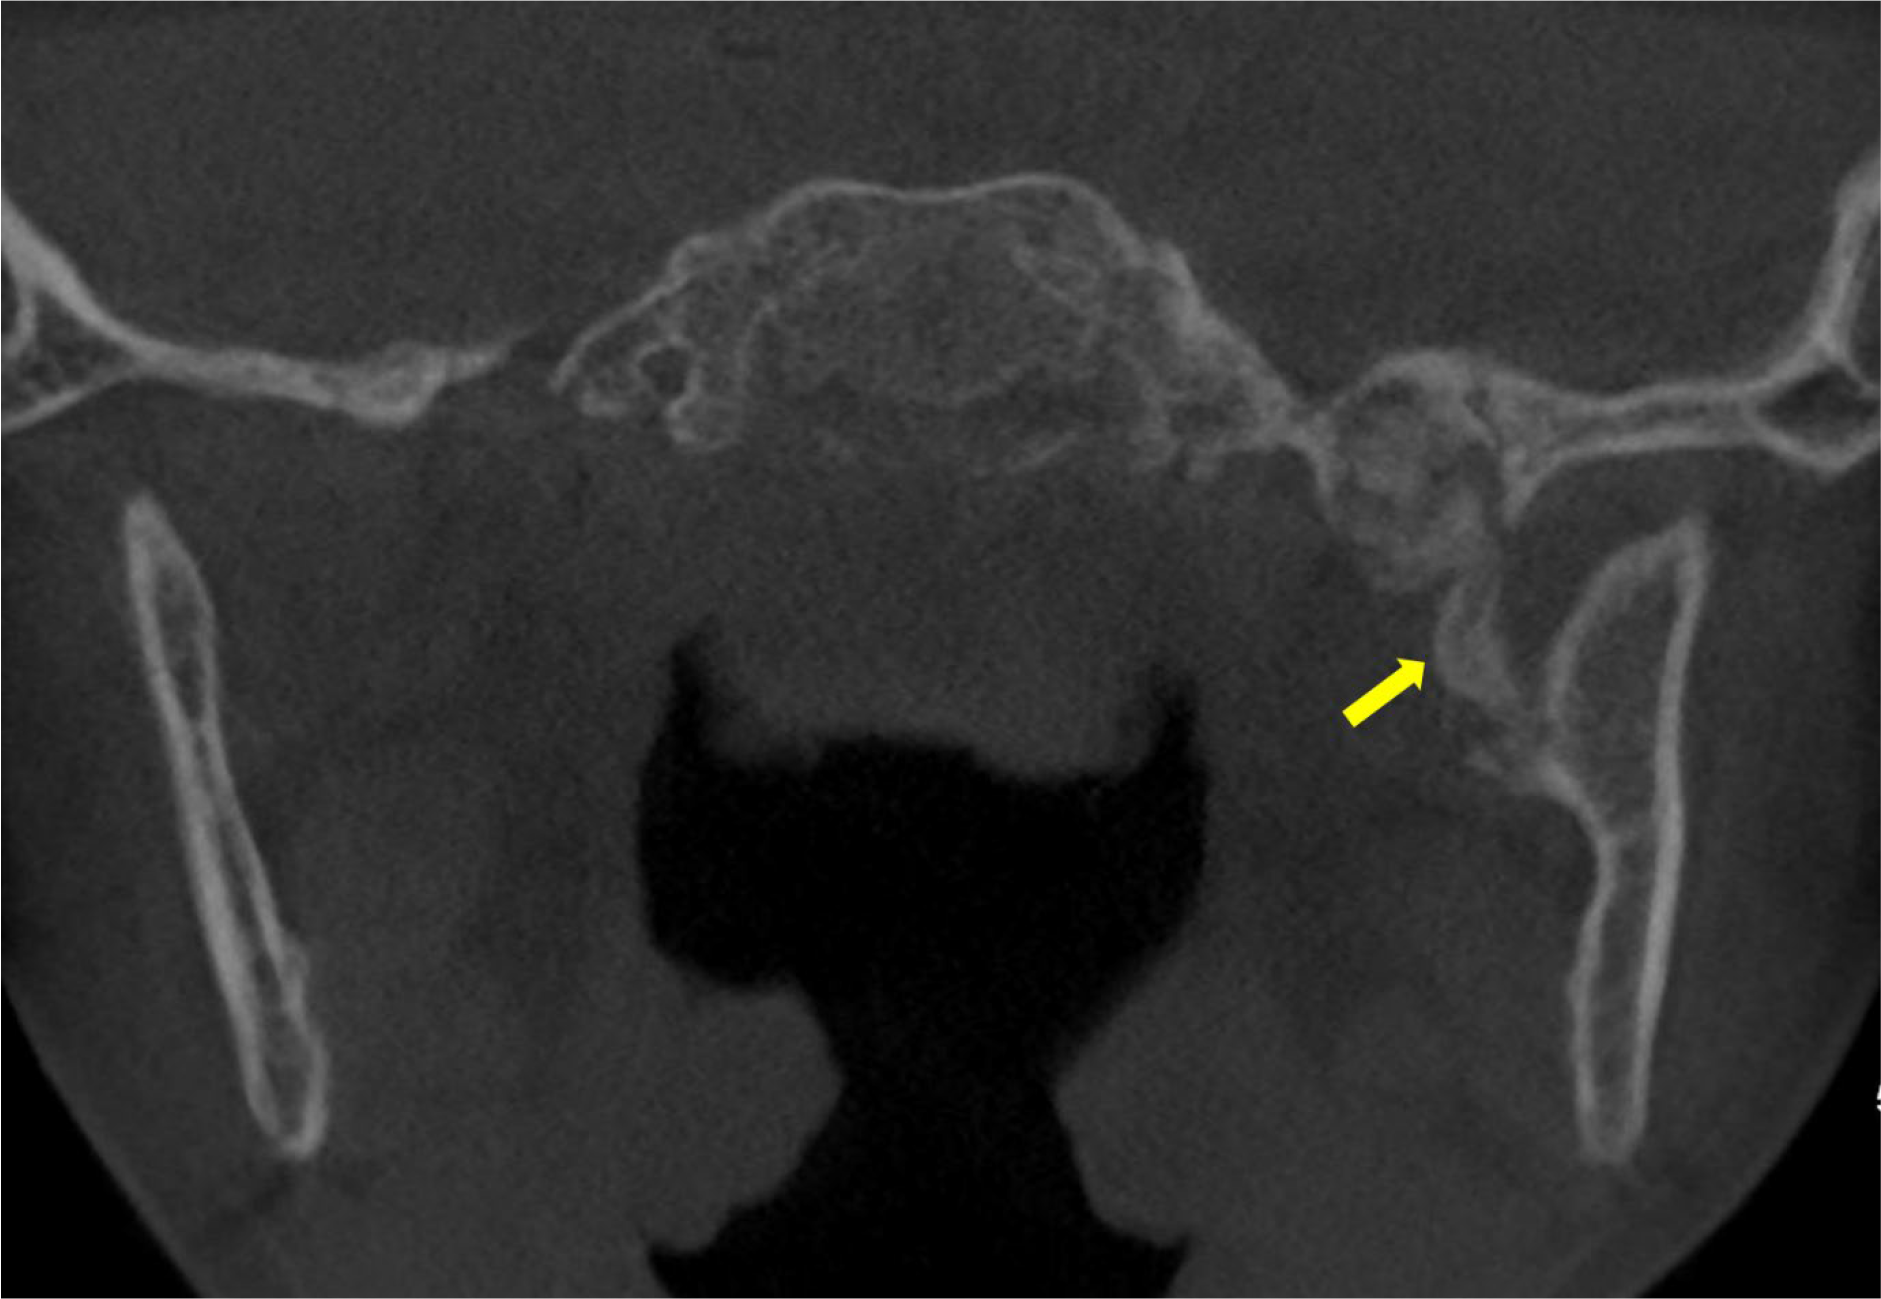
Figure 1
Unenhanced CT scan showing an ossified structure located between the left mandibular ramus and the spine the left sphenoid (arrow).
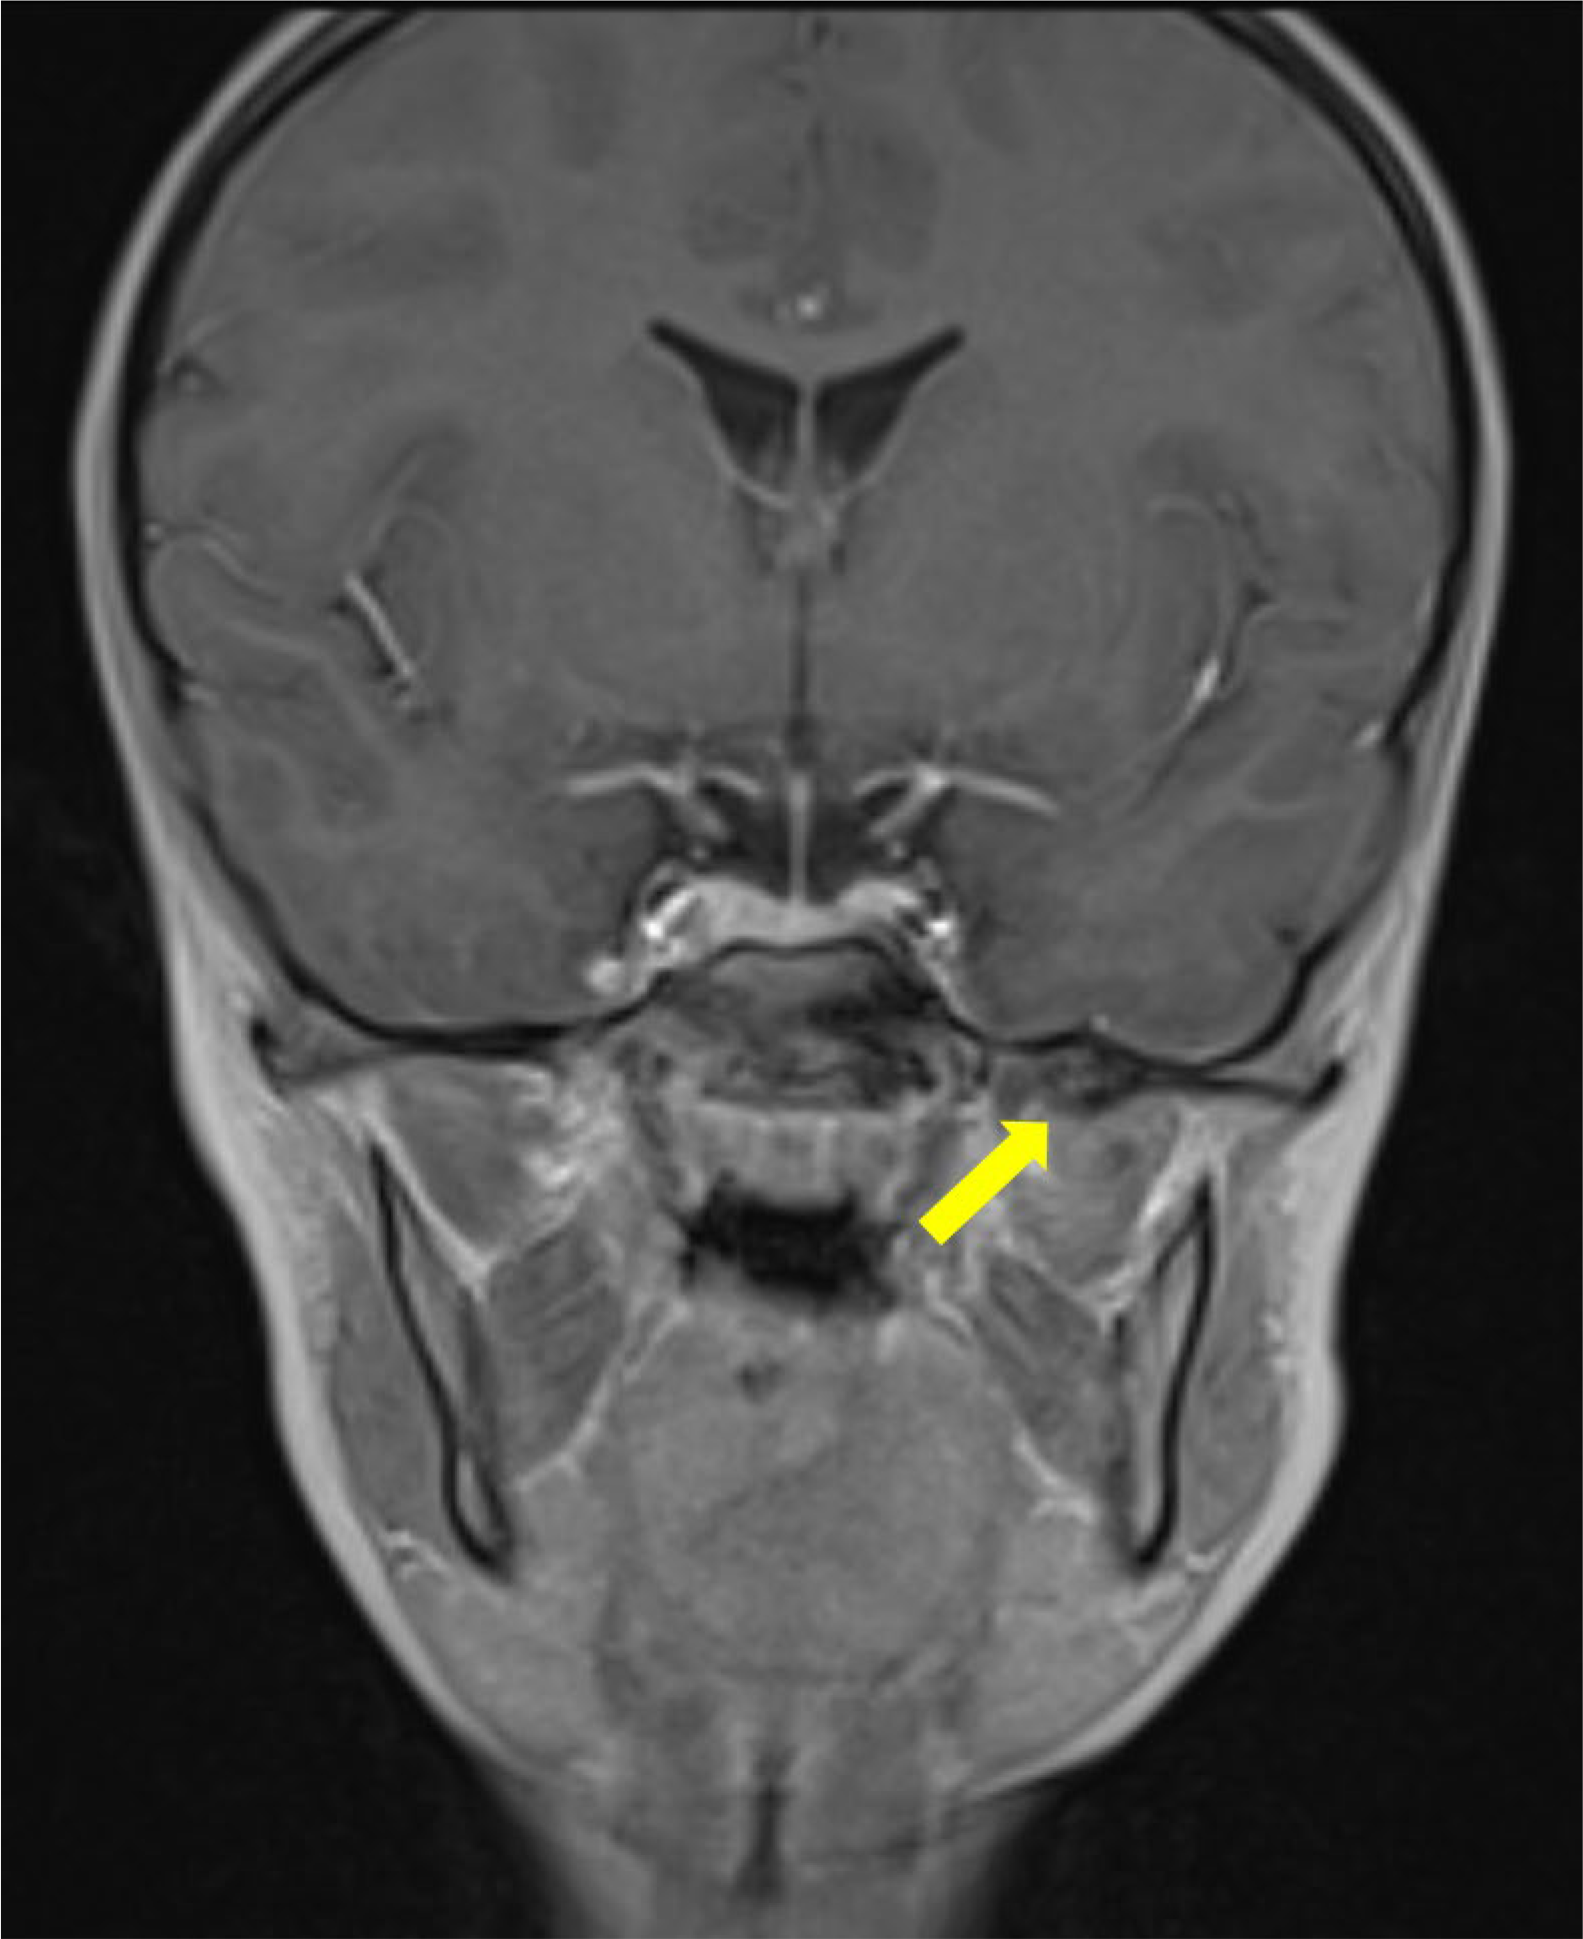
Figure 2
Contrast enhanced coronal T1 Dixon MRI scan showing the bony signal of the bony structure of the sphenoid spine (arrow) with no enhancement on the fat‑suppressed reconstructions (not shown).
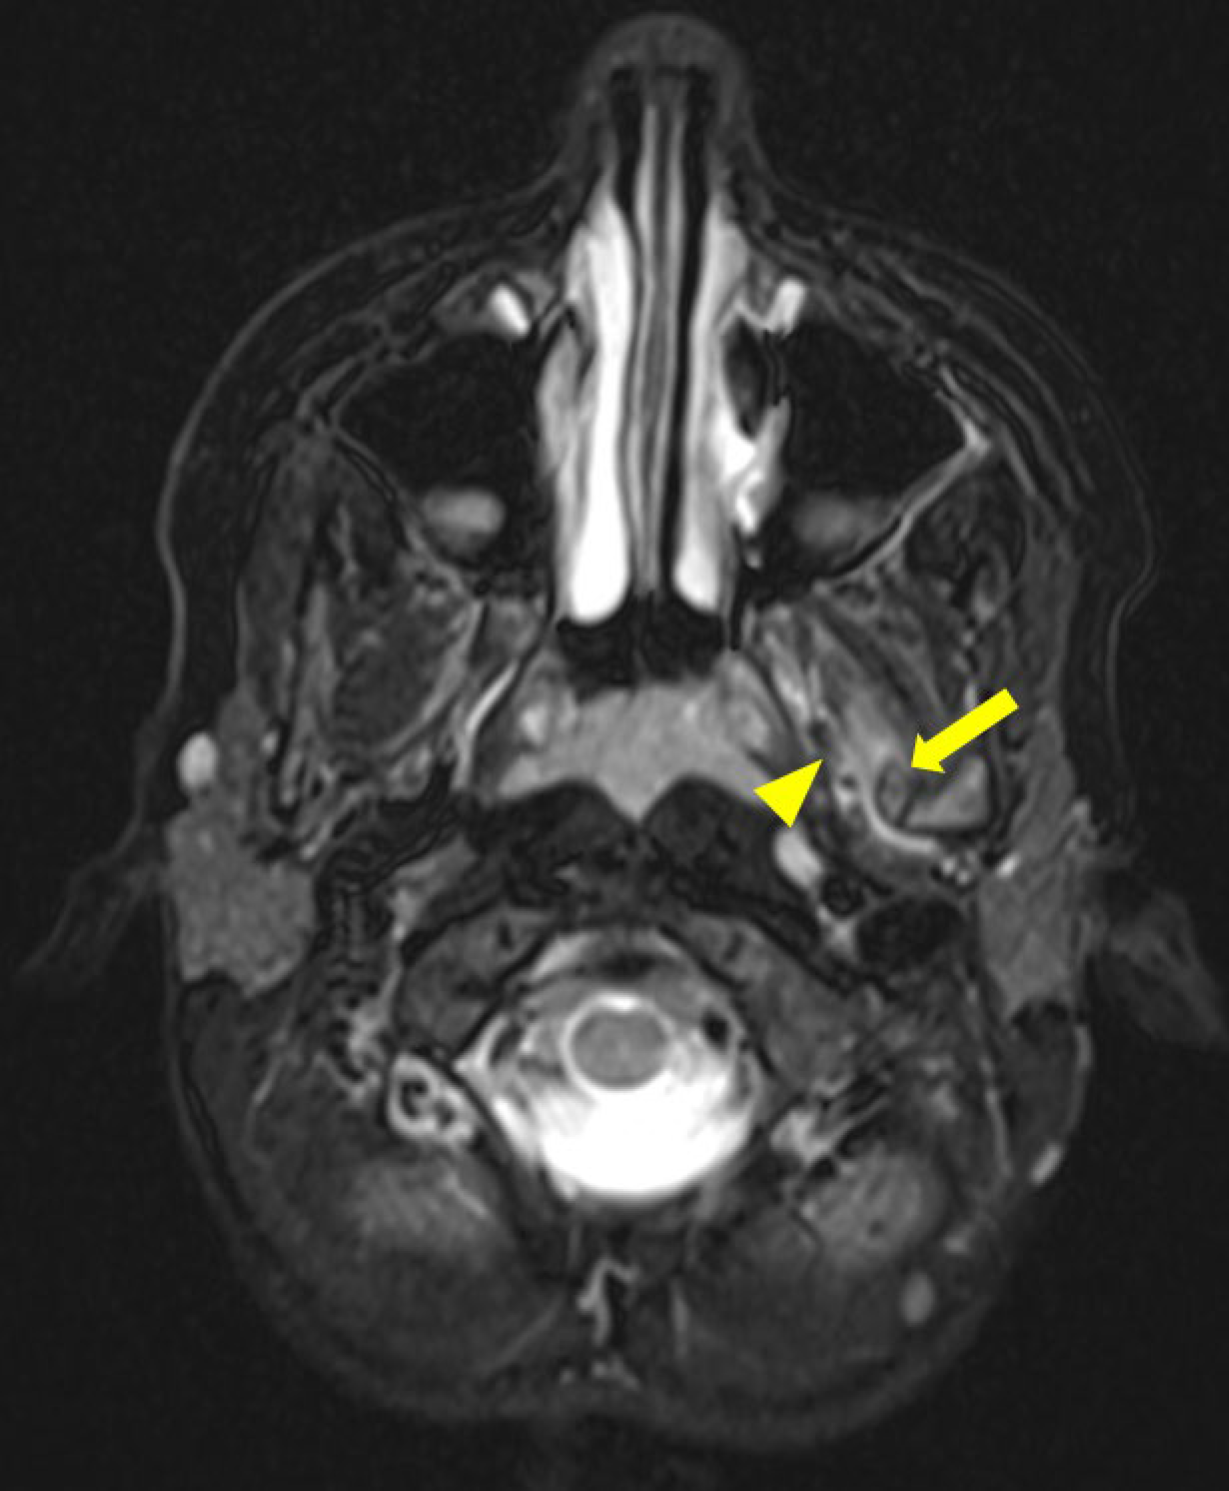
Figure 3
Axial T2 Dixon MRI scan showing edema infiltrating the lateral pterygoid muscles fibers (arrowhead) close to the ossified sphenomandibular ligament (arrow).