
Table 1
Magnetic resonance imaging acquisition parameters for the sacroiliac joints. TR: time to repeat, TE: time to echo.
| PARAMETERS | SECTION THICKNESS (MM) | FIELD OF VIEW (MM × MM) | MATRIX | TR/TE | ACQUISITION TIME (MIN:S) |
|---|---|---|---|---|---|
| T1W | 3 | 270 | 265 × 448 | 402/22 | 2:44 |
| T2W‑FS | 3 | 270 | 216 × 320 | 3220/72 | 1:41 |
| T1W‑Dixon | 3 | 250 | 195 × 320 | 607/10 | 2:11 |
| T2W‑Dixon | 3 | 270 | 202 × 320 | 4620/81 | 3:11 |
Table 2
Characteristics of the our study sample according to standard MRI protocol findings.
| STANDARD MRI PROTOCOL FINDINGS | NUMBER OF CASES | AGE RANGE (YEARS) | MEAN AGE (YEARS) | GENDER (FEMALE/MALE) |
|---|---|---|---|---|
| Positive active sacroiliitis findings | 6 | 35–45 | 39.33 | 6/0 |
| Positive chronic sacroiliitis findings | 14 | 18–47 | 33.78 | 7/7 |
| Active on chronic sacroiliitis findings | 29 | 21–50 | 36.06 | 22/7 |
| No active or chronic sacroiliitis findings | 58 | 18–48 | 36.37 | 38/20 |
| Total | 107 | 18–50 | 36.12 | 73/34 |
Table 3
The number of sacroiliac joints with positive findings on MRI sequences.
| MRI FINDINGS | T2W‑FS | T1W | T1W DIXON FO | T1W DIXON IP | T1W DIXON OP | T2W DIXON WO | T2W DIXON FO | T2W DIXON IP | T2W DIXON OP |
|---|---|---|---|---|---|---|---|---|---|
| BME | 56 | – | 57 | ||||||
| Erosion | 87 | 85 | 85 | 71 | 82 | 80 | 68 | ||
| Subchondral sclerosis | 43 | 21 | 22 | 5 | 22 | 20 | 15 | ||
| PFD | 23 | 21 | 21 | 20 | 21 | 21 | 21 | ||
| Ankylosis | 5 | 4 | 4 | 4 | 4 | 4 | 4 | ||
| Backfill | 7 | 6 | 4 | 0 | 3 | 5 | 5 |
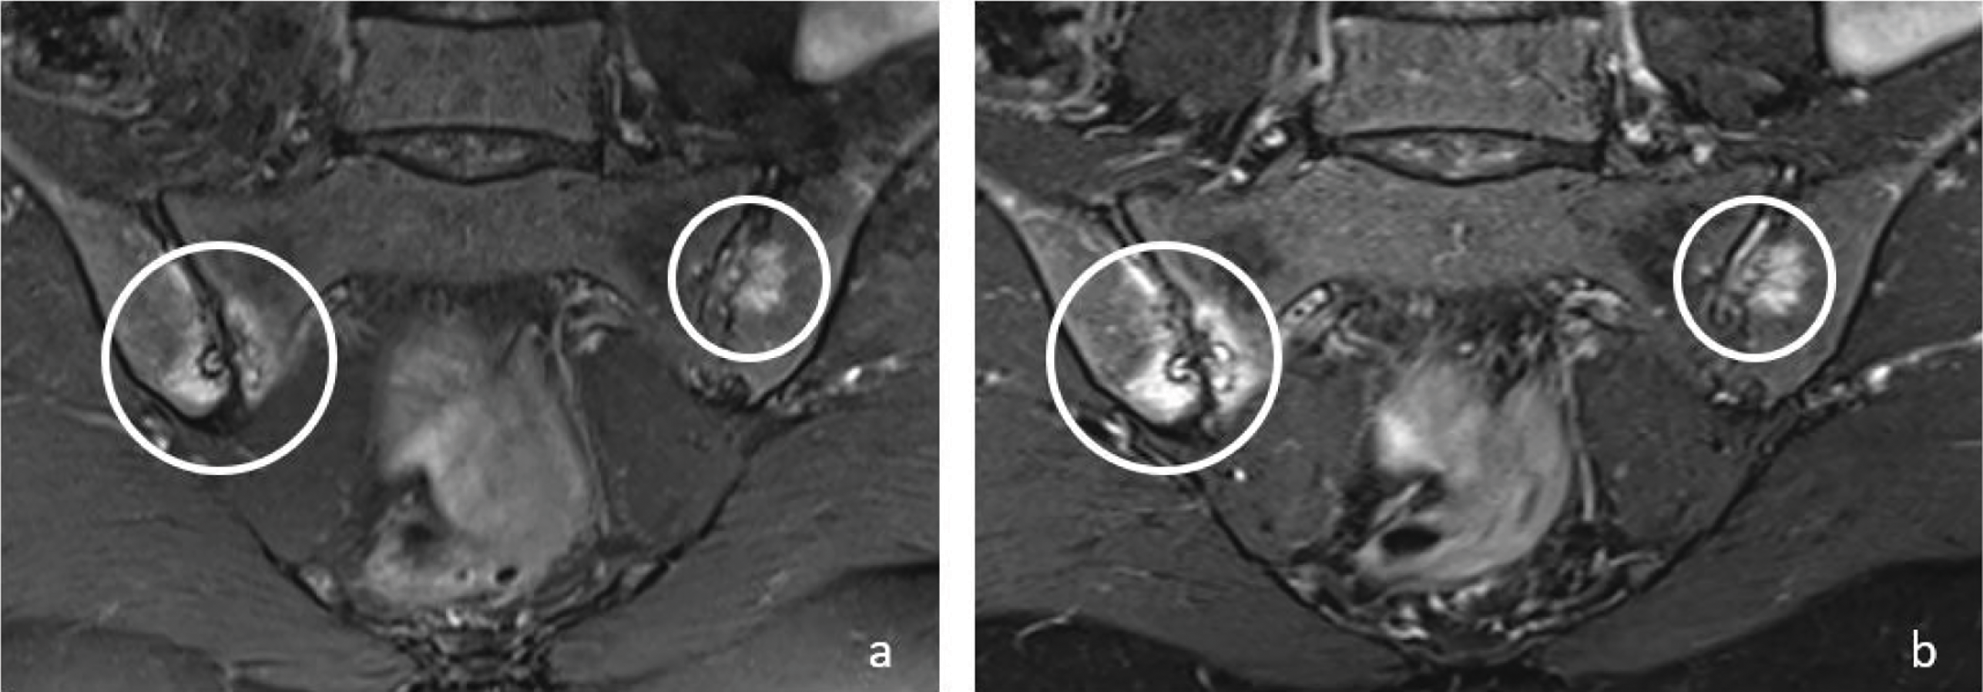
Figure 1
Coronal T2W‑FS (a) and T2W Dixon WO (b) images show bone marrow edema (circles) in both sacroiliac joints on the right sacral and iliac side and on the left iliac side in a 48‑year‑old female patient. Bone marrow edema signals are brighter on T2W Dixon WO images (b).
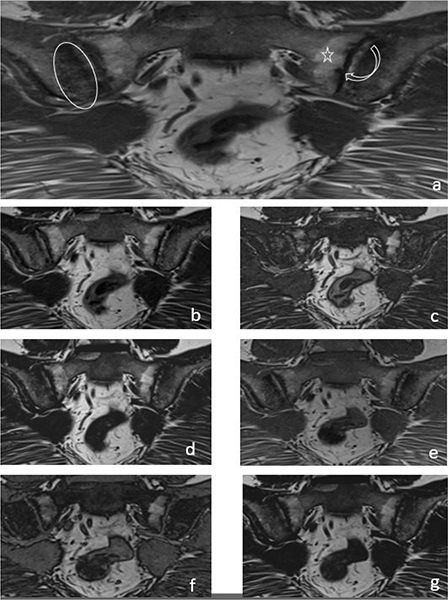
Figure 2
A 33‑year‑old female patient with iliac side sclerosis (ovoid circle), sacral side periarticular fat deposits (star) and iliac‑sacral facial erosions (curved arrow) in both sacroiliac joints marked on a T1W images (a). These findings can also be seen in T2W Dixon IP (b), T2W Dixon OP (c), T2W Dixon FO (d), T1W Dixon IP (e), T1W Dixon OP (f) and T1W Dixon FO (g) images.
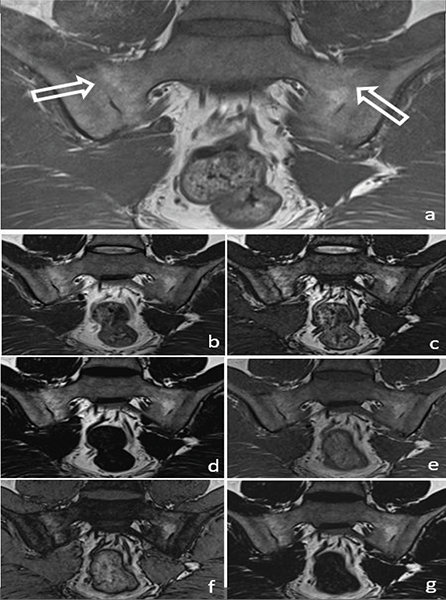
Figure 3
A 34‑year‑old male patient with ankylosis (arrow) in both sacroiliac joints on a T1W image (a) (arrows). Ankylosis can be easily seen in the T2W Dixon IP (b), T2W Dixon OP (c), T2W Dixon FO (d), T1W Dixon IP (e), T1W Dixon OP (f) and T1W Dixon FO (g) images shown in the figure.
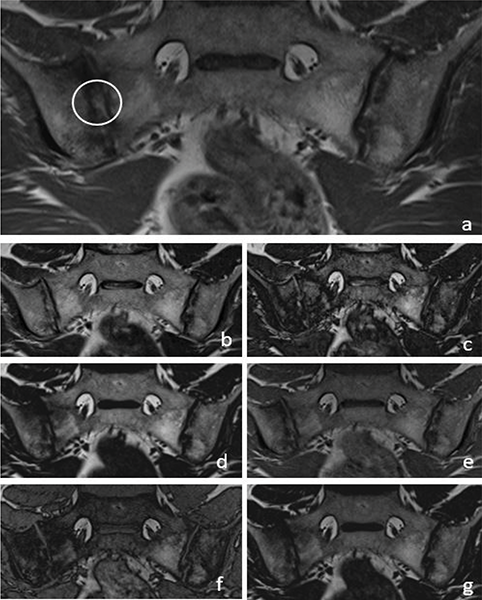
Figure 4
A 36‑year‑old male patient with backfill (circle) in the right sacroiliac joint on a T1W images (a). T2W Dixon IP (b), T2W Dixon OP (c), T2W Dixon FO (d), T1W Dixon IP (e), T1W Dixon OP (f) and T1W Dixon FO (g) images are also shown in the figure.
Table 4
Interobserver agreement assessment values at 214 SIJs for signs of active and chronic sacroiliitis.
| K | P | |
|---|---|---|
| BME, T2W‑FS | 0.93 | 0.01 |
| BME, T2W Dixon | 0.91 | 0.01 |
| Erosion, T1W | 0.84 | 0.01 |
| Sclerosis, T1W | 0.72 | 0.01 |
| PFD, T1W | 0.91 | 0.01 |
| Backfill, T1W | 0.53 | 0.01 |
| Ankylosis, T1W | 0.89 | 0.01 |
| Erosion, T1W Dixon | 0.81 | 0.01 |
| Sclerosis, T1W Dixon | 0.57 | 0.01 |
| PFD, T1W Dixon | 0.79 | 0.01 |
| Backfill, T1W Dixon | 0.66 | 0.01 |
| Ankylosis, T1W Dixon | 0.89 | 0.01 |
| Erosion, T2W Dixon | 0.78 | 0.01 |
| Sclerosis, T2W Dixon | 0.50 | 0.01 |
| PFD, T2W Dixon | 0.84 | 0.01 |
| Backfill, T2W Dixon | 0.80 | 0.01 |
| Ankylosis, T2W Dixon | 1.0 | 0.01 |
Table 5
The diagnostic performance of T1W and T2W Dixon sequences compared with the standard MRI protocol. PPV, positive predictive value; NPV, negative predictive value.
| MRI FINDINGS | SENSITIVITY (%) | SPECIFICITY (%) | PPV (%) | NPV (%) | ACCURACY (%) | |
|---|---|---|---|---|---|---|
| T1W Dixon | Erosion | 91.95 | 96.85 | 95.24 | 94.62 | 94.86 |
| Subchondral sclerosis | 44.44 | 98.22 | 89.96 | 86.91 | 86.92 | |
| PFD | 86.96 | 99.48 | 95.24 | 98.45 | 98.13 | |
| Backfill | 57.14 | 100.00 | 100.00 | 98.57 | 98.57 | |
| Ankylosis | 80.00 | 99.52 | 80.0 | 99.52 | 99.07 | |
| T2W Dixon | BME | 98.25 | 99.36 | 98.25 | 99.36 | 99.07 |
| Erosion | 88.89 | 99.19 | 98.77 | 92.48 | 94.86 | |
| Subchondral sclerosis | 37.78 | 97.63 | 80.95 | 85.49 | 85.05 | |
| PFD | 86.96 | 98.95 | 90.91 | 98.44 | 97.66 | |
| Backfill | 57.14 | 100.00 | 100.00 | 98.57 | 98.57 | |
| Ankylosis | 80.00 | 100.00 | 100.00 | 99.52 | 99.53 |