
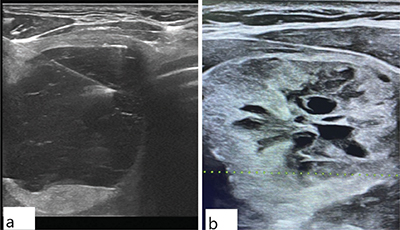
Figure 1
Ultrasound images of thyroid nodules with different categorizations.
(a) This image depicts a nodule with cystic features, characterized by smooth margins and floating colloid, along with echogenic foci and debris (TI-RADS 1). The fine-needle aspiration cytology (FNAC) results for this nodule indicated a nondiagnostic (ND) outcome.
(b) It exhibits a solid composition, an iso-hypoechoic appearance, a heterogeneous texture, central cystic regions, and a lobulated margin (TI-RADS 4). The FNAC results for this nodule indicated atypia of undetermined significance (AUS).
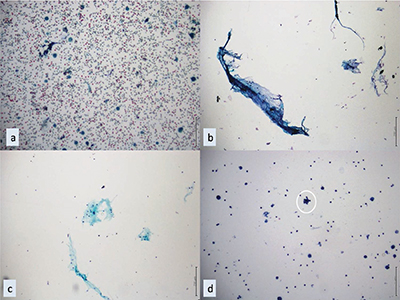
Figure 2
Cytopathological illustrations of nodules diagnosed as ND by FNAC.
(a) A case of ND without follicular cells, where macrophages were observed in the background of bleeding (PAP, x10).
(b-c) ND cases with only colloid and inflammatory cells observed in liquid-based cytology preparations (x10).
(d) An ND case in which a single group of follicular cells was observed in addition to macrophages on the colloidal background; the thyrocyte group is highlighted in the circle (liquid-based cytology, x10).
PAP: Papanicolaou Stain, ND: Nondiagnostic, FNAC: Fine Needle Aspiration Cytology.
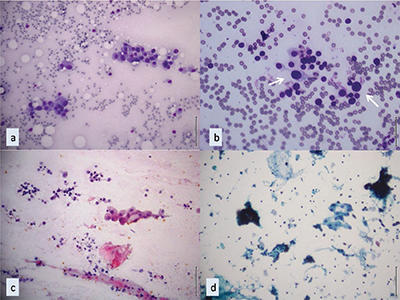
Figure 3
Cytopathological illustrations of nodules diagnosed as AUS by FNAC.
(a) An AUS case displaying a small number of oncocytic follicular cells in non-colloidal hypocellular smears (MGG, x10).
(b) An AUS case featuring a small number of follicular cells with nuclear enlargement and membrane irregularities in the predominantly benign preparation; atypical cells are indicated with white arrows (MGG, x20).
(c-d) Atypical cyst-lining epithelial cells observed in the nodule, radiologically defined as cystic (c: PAP, magnification x10; d: liquid-based cytology, PAP, x10).
MGG: May-Grünwald Giemsa, PAP: Papanicolaou Stain, AUS: Atypia of Undetermined Significance, FNAC: Fine Needle Aspiration Cytology.
Table 1
Comparison of characteristics of nodules in Bethesda Category I (ND) and Category III (AUS) based on FNA results.
| TOTAL N = 1152 | CATEGORY I (ND) N1 = 1,110 | CATEGORY III (AUS) N2 = 142 | P (2-SIDED) | ||
|---|---|---|---|---|---|
| Age (Median, IQR) | 55 (46–65) | 55 (46–65) | 54 (43–63) | 0.284 | |
| Nodule size (mm) (Median, IQR) | 15 (12–22) | 15 (11–22) | 16 (12–24) | 0.321 | |
| Nodule size (mm) (n, %) | <10 mm | 108 (8.6) | 98 (8.8%) | 10 (7.0%) | 0.475 |
| ≥10 mm | 1144 (91.4) | 1012 (91.2) | 132 (93.0%) | ||
| TI-RADS Score (Median, IQR) | 4 (4–5) | 4 (4–5) | 4 (4–5) | 0.599 | |
| Gender (n, %) | Male | 319 (25.5%) | 289 (26.0%) | 30 (21.1%) | 0.206 |
| Female | 933 (74.5%) | 821 (74.0%) | 112 (78.9%) | ||
| Composition (n, %) | Cystic or almost completely cystic | 43 (3.4%) | 37 (3.3%) | 6 (4.2%) | 0.693 |
| Spongiform | 8 (0.6%) | 8 (0.7%) | 0 (0.0%) | ||
| Mixed cystic and solid | 259 (20.7%) | 228 (20.5%) | 31 (21.8%) | ||
| Solid or almost completely solid | 942 (75.2%) | 837 (75.4%) | 105 (73.9%) | ||
| Echogenicity (n, %) | Anechoic | 47 (3.8%) | 41 (3.7%) | 6 (4.2%) | 0.160 |
| Hyper- or isoechoic | 799 (63.8%) | 699 (63.0%) | 100 (70.4%) | ||
| Hypoechoic | 406 (32.4%) | 370 (33.3%) | 36 (25.4%) | ||
| Shape (n, %) | Wider-than-tall | 1,242 (99.2%) | 1,101 (99.2%) | 141 (99.3%) | 1.000 |
| Taller-than-wide | 10 (0.8%) | 9 (0.8%) | 1 (0.7%) | ||
| Margin (n, %) | Smooth—ill-defined | 1,147 (91.6%) | 1,020 (91.9%) | 127 (89.4%) | 0.585 |
| Lobulated or irregular | 74 (5.9%) | 63 (5.7%) | 11 (7.7%) | ||
| Extra-thyroidal extension | 31 (2.5%) | 27 (2.4%) | 4 (2.8%) | ||
| Echogenic foci (n, %) | None or large comet-tail artifacts | 1,006 (80.4%) | 894 (80.5%) | 112 (78.9%) | 0.965 |
| Macrocalcifications | 133 (10.6%) | 117 (10.5%) | 16 (11.3%) | ||
| Peripheral (rim) calcifications | 35 (2.8%) | 31 (2.8%) | 4 (2.8%) | ||
| Punctate echogenic foci | 78 (6.2%) | 68 (6.1%) | 10 (7.0%) | ||
| Internal structure (n, %) | Homogeneous | 586 (46.8%) | 517 (46.6%) | 69 (48.6%) | 0.651 |
| Heterogeneous | 666 (53.2%) | 593 (53.4%) | 73 (51.4%) | ||
| TI-RADS categories (n, %) | TI-RADS 1 | 41 (3.3%) | 35 (3.2%) | 6 (4.2%) | N/A |
| TI-RADS 2 | 11 (0.9%) | 11 (1.0%) | 0 (0.0%) | ||
| TI-RADS 3 | 214 (17.1%) | 191 (17.2%) | 23 (16.2%) | ||
| TI-RADS 4 | 822 (65.7%) | 727 (65.5%) | 95 (66.9%) | ||
| TI-RADS 5 | 164 (13.1%) | 146 (13.2%) | 18 (12.7%) | ||
| Localization (n, %) | Right | 665 (53.1%) | 586 (52.8%) | 79 (55.6%) | 0.804 |
| Left | 537 (42.9%) | 479 (43.2%) | 58 (40.8%) | ||
| İsthmus | 50 (4.0%) | 45 (4.1%) | 5 (3.5%) | ||
| Number of nodules (n, %) | Soliter | 1,217 (97.2%) | 1,078 (97.1%) | 139 (97.9%) | 0.789 |
| Multiple | 35 (2.8%) | 32 (2.9%) | 3 (2.1%) | ||
| Parenchymal disease (n, %) | Present | 149 (11.9%) | 132 (11.9%) | 17 (12.0%) | 0.978 |
| Absent | 1,103 (88.1%) | 978 (88.1%) | 125 (88.0%) | ||
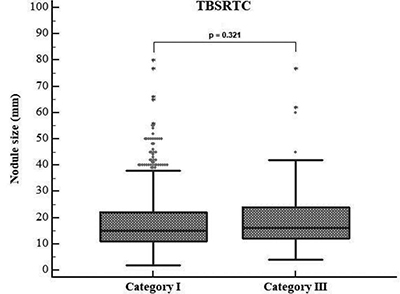
Figure 4
Relationship between nodule size and Bethesda Categories I (ND) and III (AUS)—distribution of nodule size in both categories. No statistically significant relationship was observed between nodule size and Bethesda categories I and III (p = 0.321).
ND: Nondiagnostic, AUS: Atypia of Undetermined Significance, TBSRTC: The Bethesda System for Reporting Thyroid Cytopathology.