
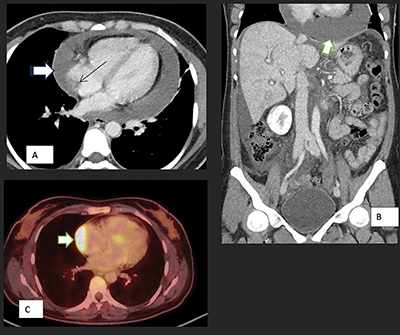
Figure 1
Axial (A) and coronal (B) CT scan images show pericardial effusion (white arrow) and enhancing pericardium, evidence of right heart failure with IVC enlargement and periportal oedema, features of early cardiac tamponade. The thin arrow points to the soft tissue mass in the atrium.
Axial PET-CT (C) shows pathological metabolic activity in the known mass in the right atrium (arrow) extending along the pericardium with intensely increased FDG uptake.
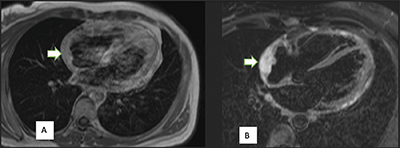
Figure 2
Right atrium angiosarcoma, a broad-based mass in the right atrium associated with thickening of the pericardium, is predominantly isointense to the myocardium on the T1-weighted image (arrow) (A). On the T2-weighted image (B), the mass shows a typical hyperintensity (arrow).
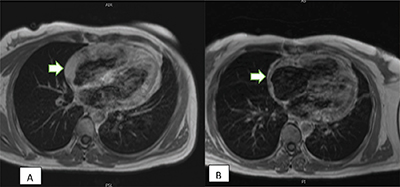
Figure 3
(A) Post-contrast T1 imaging before the treatment; (B) Post-contrast T1 imaging following chemotherapy treatment reveals a partial response with decreased tumor thickness (arrow).
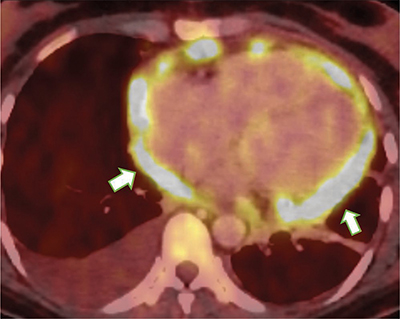
Figure 4
Nodular thickening of the pericardium with intense FDG uptake (arrows).