

Figure 1
Axial T2WI (upper row), axial TOF (middle row), and axial TOF after IV-gadolinium (lowest row) show a diffuse vascular network in the right hemisphere within normal brain parenchyma.

Figure 2
Right internal carotid artery digital subtraction angiography (DSA) in frontal (left images) and lateral (middle) views and right vertebral artery DSA in lateral views (right images) during the arterial (upper row) and late arterial (lower row) phases show a diffuse vascular network in the right hemisphere with no dominant arterial feeders and persistent opacification into the late arterial phase. Venous drainage is to the superior sagittal sinus and deep venous system.
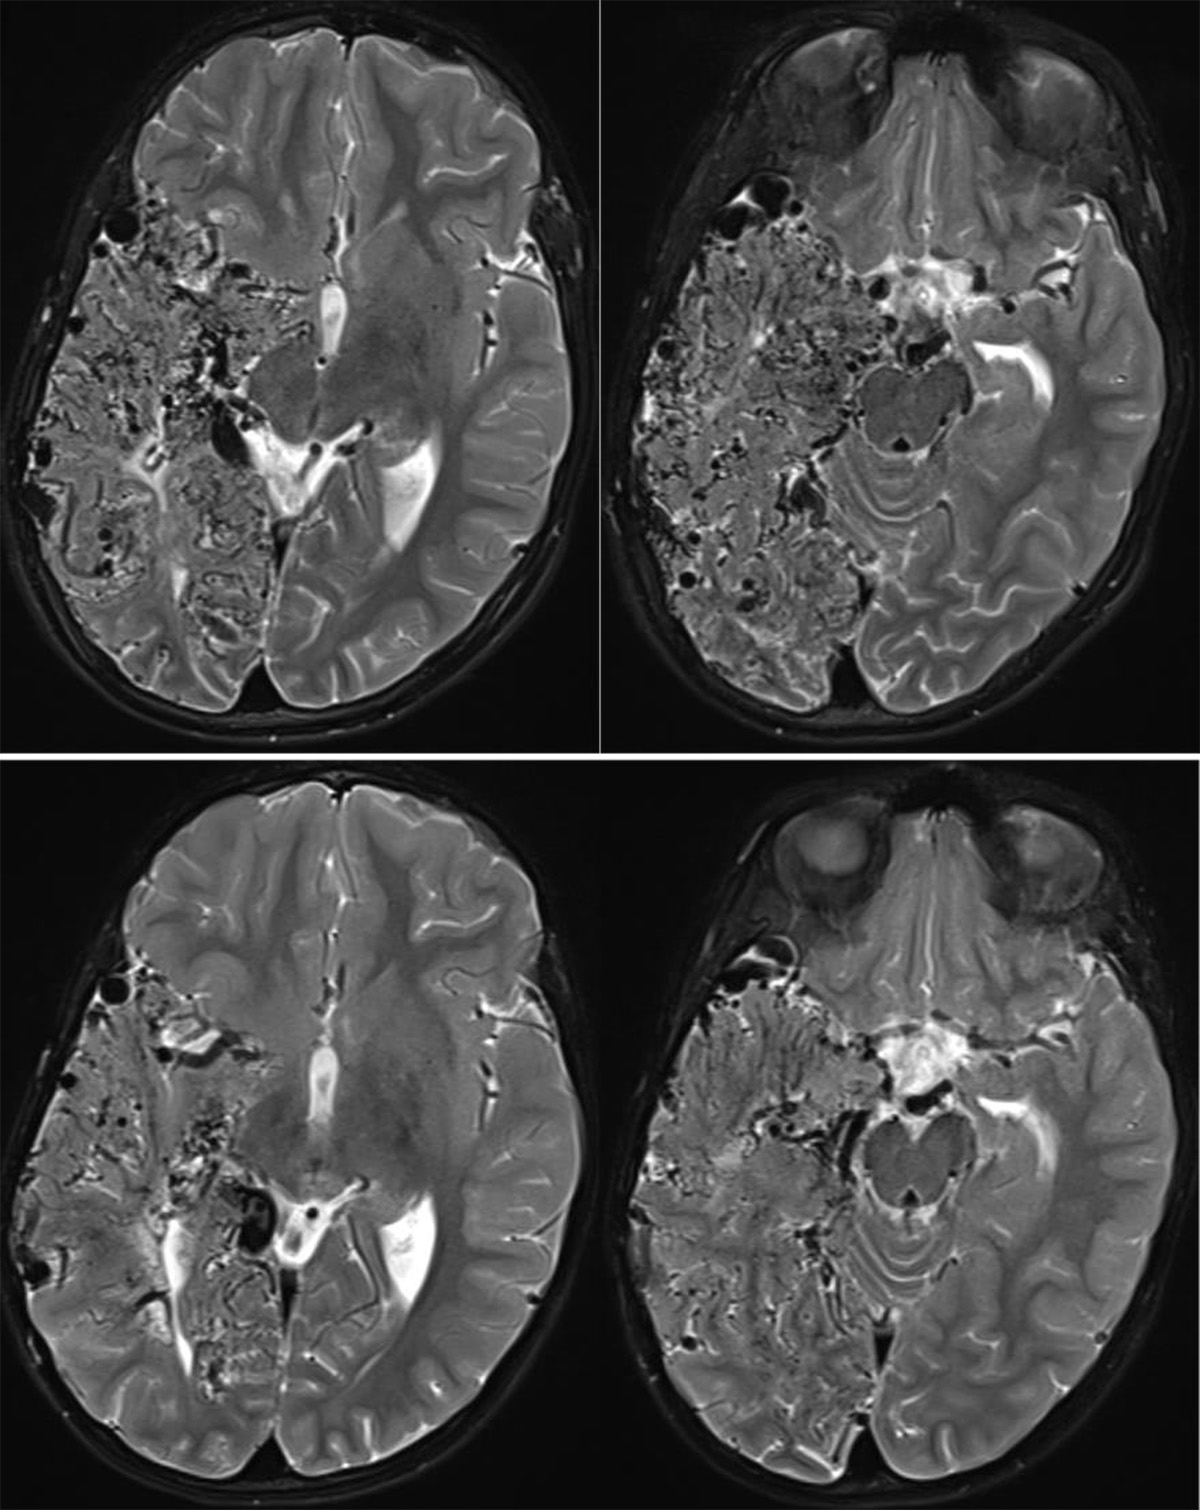
Figure 3
Axial T2WI during second presentation (lower row) and five years later (upper row) demonstrate progression of the vascular network in the right temporal and occipital lobes.