
Table 1
Specificity and sensitivity.
| SENSITIVITY (%) | SPECIFICITY (%) | PPV (%) | NPV (%) | ACCURACY (%) | ||
|---|---|---|---|---|---|---|
| T1 | Observer 1 | 31.5 | 100 | 100 | 61.2 | 68.1 |
| Observer 2 | 76.3 | 95 | 93.8 | 80.3 | 85.7 | |
| T2 | Observer 1 | 8.5 | 100 | 100 | 52.6 | 54.6 |
| Observer 2 | 86.4 | 51.7 | 63.7 | 79.5 | 68.9 | |
| GE | Observer 1 | 86.7 | 95 | 94.5 | 87.7 | 90.8 |
| Observer 2 | 88.3 | 95 | 94.6 | 89.1 | 91.7 |
[i] GE, gradient echo; NPV, negative predictive value; PPV, positive predictive value.
Table 2
Kappa values of inter- and intraobserver variability.
| VARIABILITY | T1 | T2 | GE | CT |
|---|---|---|---|---|
| Interobserver | 0.462 | 0.057 | 0.889 | 0.922 |
| Intraobserver 1 | 0.581 | 0.567 | 0.866 | 1 |
| Intraobserver 2 | 0.608 | N/A* | 0.910 | 1 |
[i] *No statistic computed since the second observation was a constant, all scans were scored as absent VP.
CT, computed tomography; GE, gradient echo.
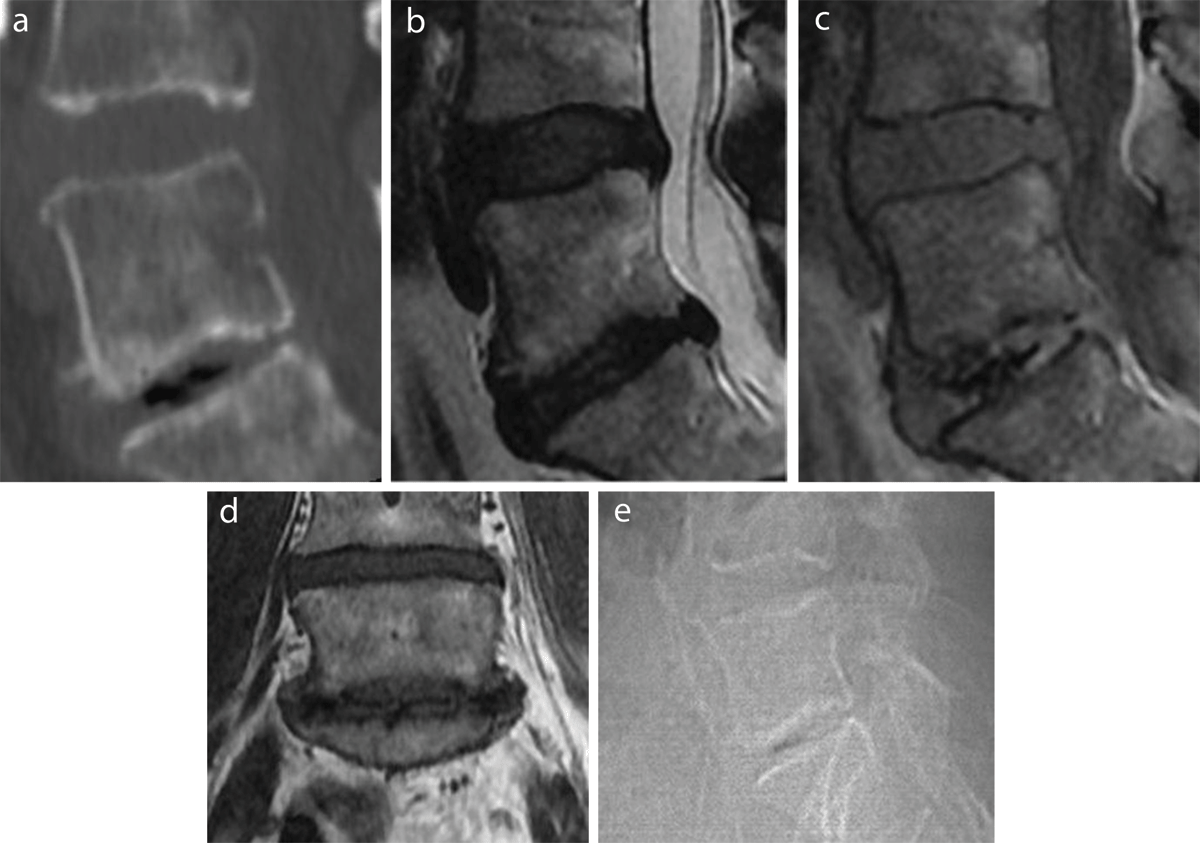
Figure 1
VP as intradiscal gas in the lower (L5-S1) of the two visualized discs (L4-L5 and L5-S1) on a sagittal reconstruction of a CT lumbar spine in bone window (a), a sagittal T2- (b) and GE-weighted image (c), a coronal T1-weighted image (d), and the lateral scout image from the CT exam (e).