
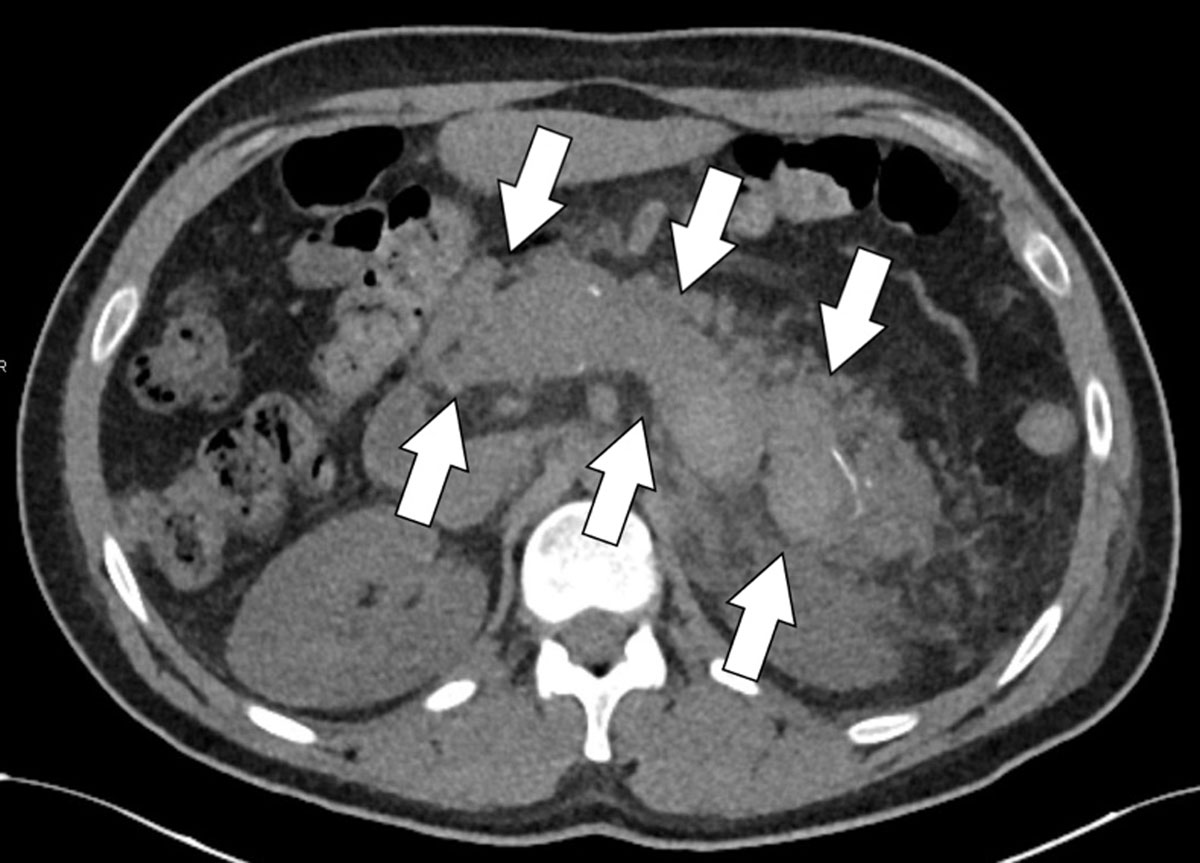
Figure 1a
Axial unenhanced CT-slice revealing a spontaneously hyperdense splenic vein thrombus.
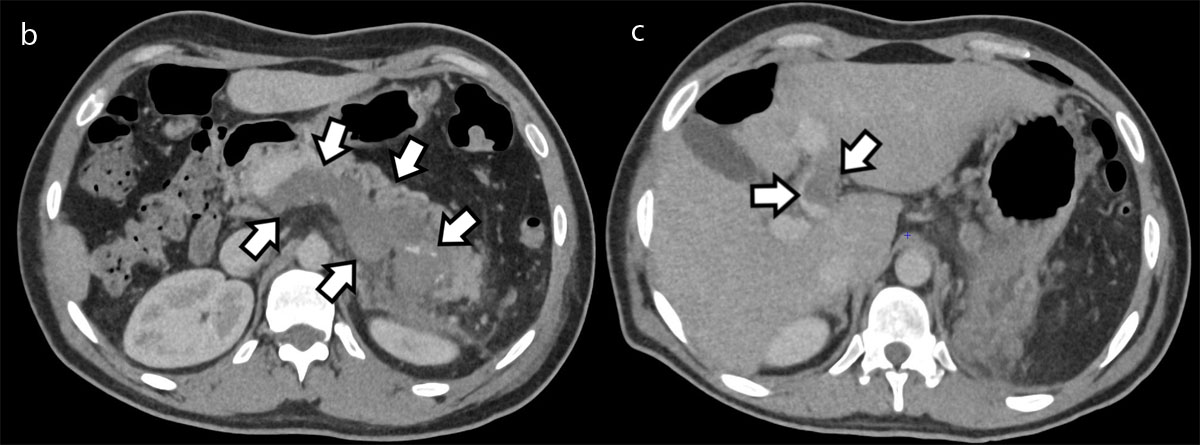
Figure 1b and c
Axial contrast-enhanced portal phase CT slices at the level of the splenic vein (Figure 1b) and portal vein (Figure c) confirming a thrombosis of the splenic vein, extending into the portal vein as well as the part of the intrahepatic segment of the left branch of the portal vein (arrows).
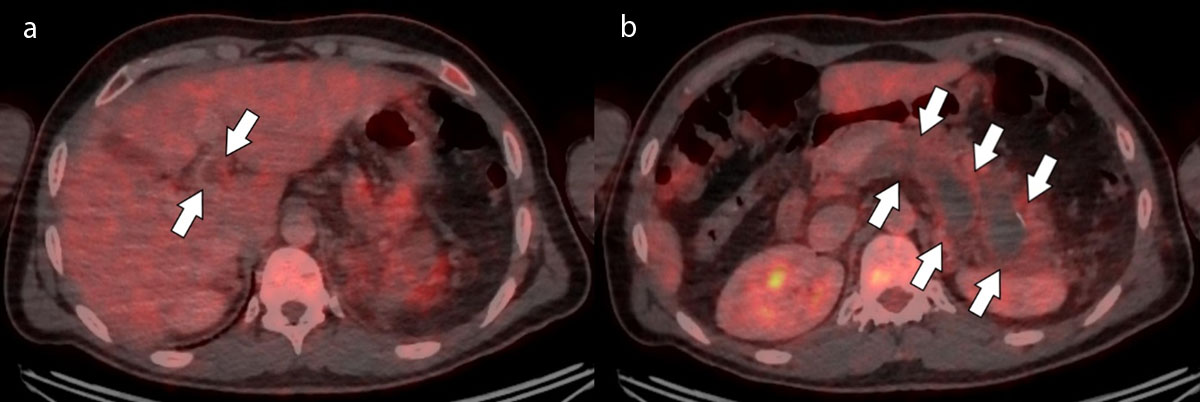
Figure 2
Axial FDG-PET/CT slices at the level of the splenic vein (Figure 2a) and portal vein (Figure 2b) showing absence of metabolism within the thrombus and some hypermetabolic infiltration of surrounding fat (arrows).