
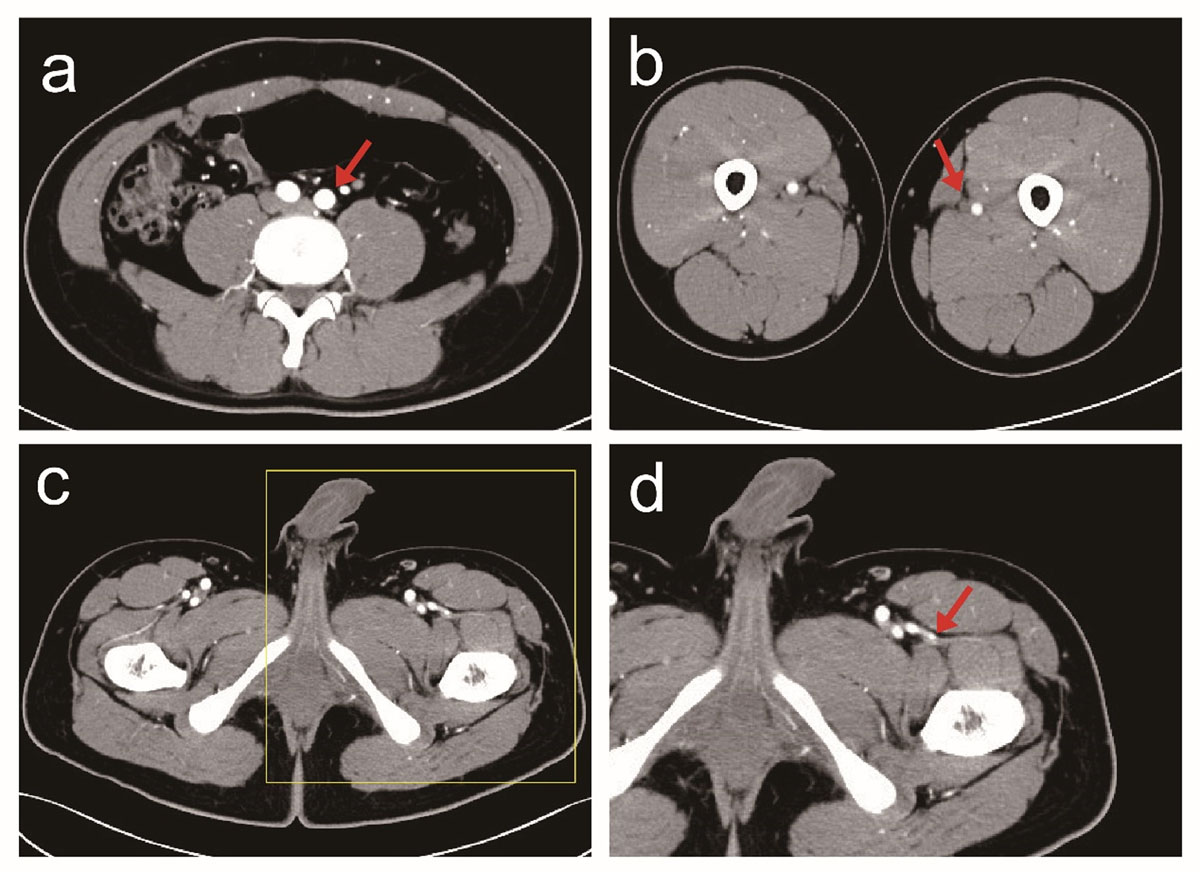
Figure 1
CTA Data Processing. a. The abdominal aorta bifurcation level; b. The mid-level of the left FA; c. The first perforating branch of the descending branch of the left lateral circumflex femoral artery (CFA), penetrated by 1 cm; d. The first perforating branch of the descending branch of the left lateral CFA, with 10 times magnified.
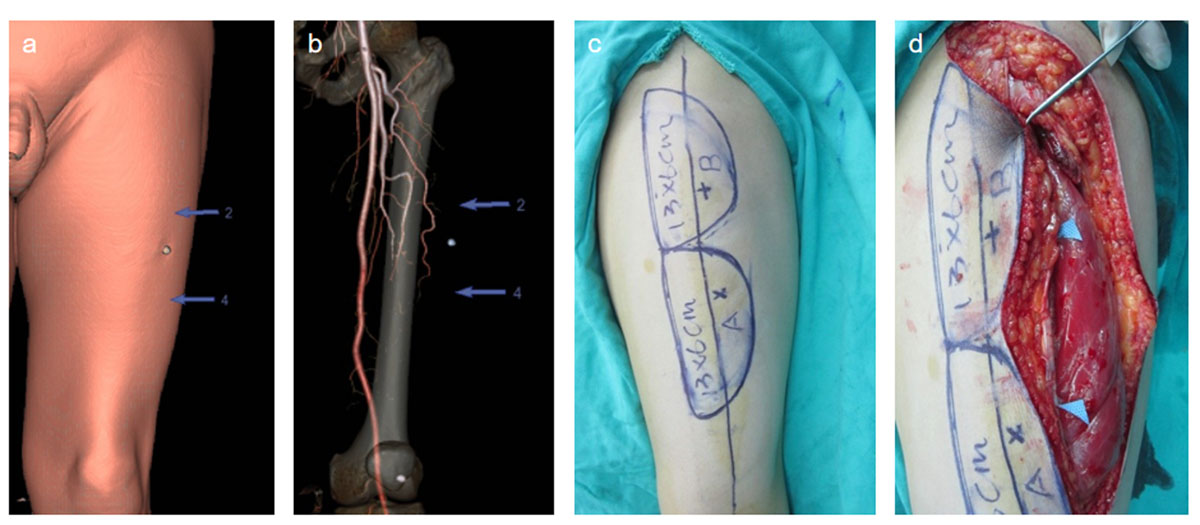
Figure 2
Comparison between preoperative and intraoperative body surface simulation positioning of CTA. a. Simulation and positioning of the body table; b. VR projection of perforating vessels; c. Preoperative surgical plan design; d. Intraoperative positioning of perforator.
Table 1
Image quality control related to the three.
| VARIABLE | GROUP | P | |||
|---|---|---|---|---|---|
| A | B | C | |||
| BMI | 17.61 ± 0.91 | 21.62 ± 1.22 | 22.76 ± 3.44 | 0.20 | |
| Gender(n) | Male | 3 | 16 | 5 | 0.10 |
| Female | 15 | 40 | 38 | ||
| Age | 48.06 ± 15.94 | 42.80 ± 13.45 | 42.72 ± 9.16 | 0.25 | |
| CTA positioning | 6.67 ± 1.94 | 5.50 ± 2.17 | 3.35 ± 1.31 | 0.001 | |
| IA | 432.42 ± 88.17 | 426.67 ± 87.84 | 419.00 ± 81.99 | 0.82 | |
| SIA | 65.99 ± 7.52 | 66.99 ± 6.83 | 63.95 ± 7.20 | 0.11 | |
| SNRIA | 153.53 ± 22.58 | 155.61 ± 24.33 | 159.89 ± 29.36 | 0.61 | |
| SNRSIA | 23.81 ± 3.80 | 24.77 ± 3.60 | 24.57 ± 4.28 | 0.66 | |
| CNRIA | 129.73 ± 22.36 | 130.84 ± 23.26 | 135.32 ± 27.13 | 0.60 | |
| FA | 152.83 ± 15.79 | 162.36 ± 13.73 | 160.02 ± 13.97 | 0.05 | |
| SFA | 65.76 ± 6.30 | 67.76 ± 5.20 | 68.32 ± 6.36 | 0.29 | |
| SNRFA | 52.04 ± 6.95 | 51.40 ± 7.68 | 51.45 ± 5.22 | 0.94 | |
| SNRSFA | 22.39 ± 2.77 | 21.40 ± 2.59 | 22.00 ± 2.75 | 0.31 | |
| CNRFA | 29.64 ± 6.05 | 30.00 ± 6.00 | 29.44 ± 4.82 | 0.89 | |
| CFA | 463.78 ± 83.81 | 420.70 ± 68.01 | 434.35 ± 76.14 | 0.10 | |
| SCFA | 65.00 ± 5.70 | 65.55 ± 3.67 | 67.31 ± 5.40 | 0.10 | |
| SNRCFA | 156.46 ± 39.23 | 146.85 ± 31.66 | 155.46 ± 23.72 | 0.29 | |
| SNRCFA | 22.07 ± 4.22 | 23.17 ± 5.56 | 24.39 ± 3.71 | 0.19 | |
| CNRCFA | 134.39 ± 37.41 | 123.67 ± 28.09 | 131.07 ± 22.58 | 0.25 | |
[i] BMI, CTA positioning difference between CTA positioning and intraoperative positioning. IA, FA, and CFA referred to the average CT values of the three groups of blood vessels. SIA, SFA, and SCF referred to the average CT values of the three groups of para-arterial soft tissues. SNRIA, SNRFA, and SCFA, referred to SNR of the three groups of blood vessels. SNRSIA, SNRSFA, and SNRCFA referred to the soft tissue SNR of the three groups. CNRIA, CNRFA, and CNRCFA referred to CNRs of the three groups of arteries.
Table 2
Correlation analysis of BMI and CT values of arteries in various parts. There was no statistically obvious difference between BMI and related image quality control indicators. There was a correlation between BMI and CTA positioning.
| VARIABLE | x̄ ± s | r | P |
|---|---|---|---|
| CAT positioning | 4.89 ± 2.22 | –0.61 | 0.001 |
| IA | 424.74 ± 81.99 | 0.01 | 0.95 |
| SIA | 65.71 ± 7.15 | –0.13 | 0.18 |
| SNRIA | 156.86 ± 25.95 | 0.08 | 0.39 |
| SNRSIA | 24.55 ± 3.87 | –0.04 | 0.67 |
| CNRIA | 132.32 ± 24.53 | 0.09 | 0.33 |
| FA | 160.03 ± 14.39 | 0.08 | 0.39 |
| SFA | 67.66 ± 5.84 | 0.08 | 0.37 |
| SNRFA | 51.51 ± 6.71 | 0.08 | 0.39 |
| SNRSFA | 21.78 ± 2.68 | –0.04 | 0.68 |
| CNRFA | 29.74 ± 5.56 | –0.03 | 0.74 |
| CFA | 432.34 ± 74.45 | –0.05 | 0.58 |
| SCFA | 66.11 ± 4.75 | 0.13 | 0.14 |
| SNRCFA | 151.49 ± 30.41 | 0.04 | 0.66 |
| SNRCFA | 23.45 ± 4.78 | 0.14 | 0.12 |
| CNRCFA | 128.04 ± 27.98 | 0.02 | 0.83 |
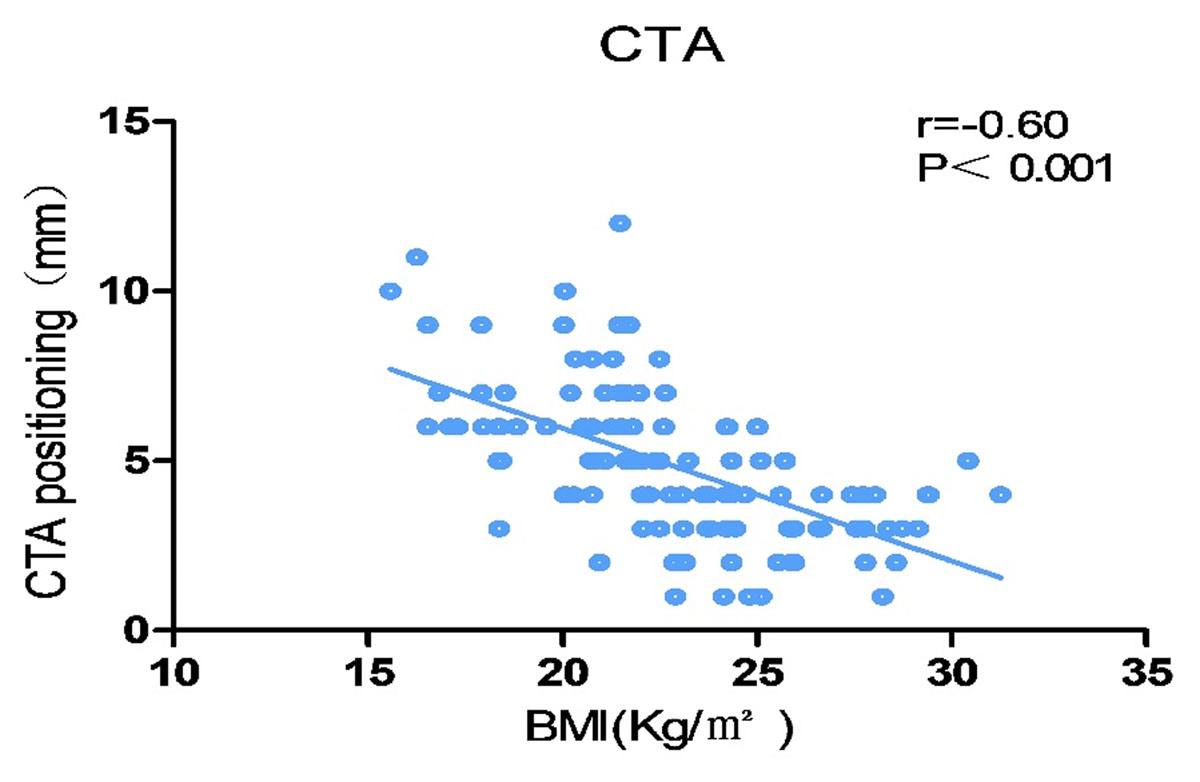
Figure 3
Correlation between BMI and CTA positioning. There was an obvious negative correlation between BMI and CTA positioning. The larger the BMI, the smaller the CTA positioning difference.
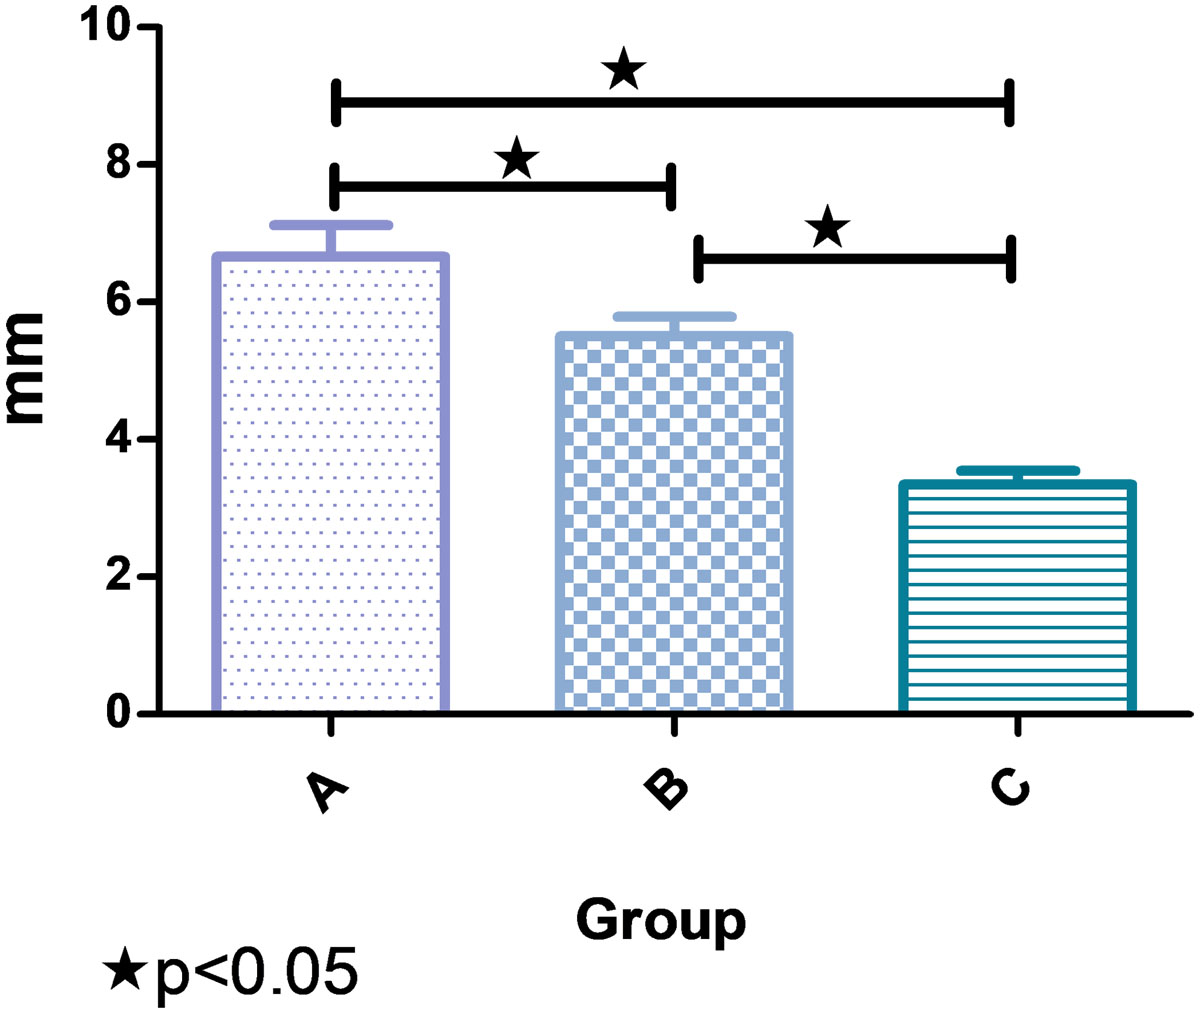
Figure 4
Comparison of CTA positioning of BMI in the three groups. There were notable differences in CTA positioning among the three groups.