
Figure 1
CT images in 17-year-old young men with Hodgkin’s lymphoma stage IIB. Illustration of nodal lesion delimitation, image filtration.

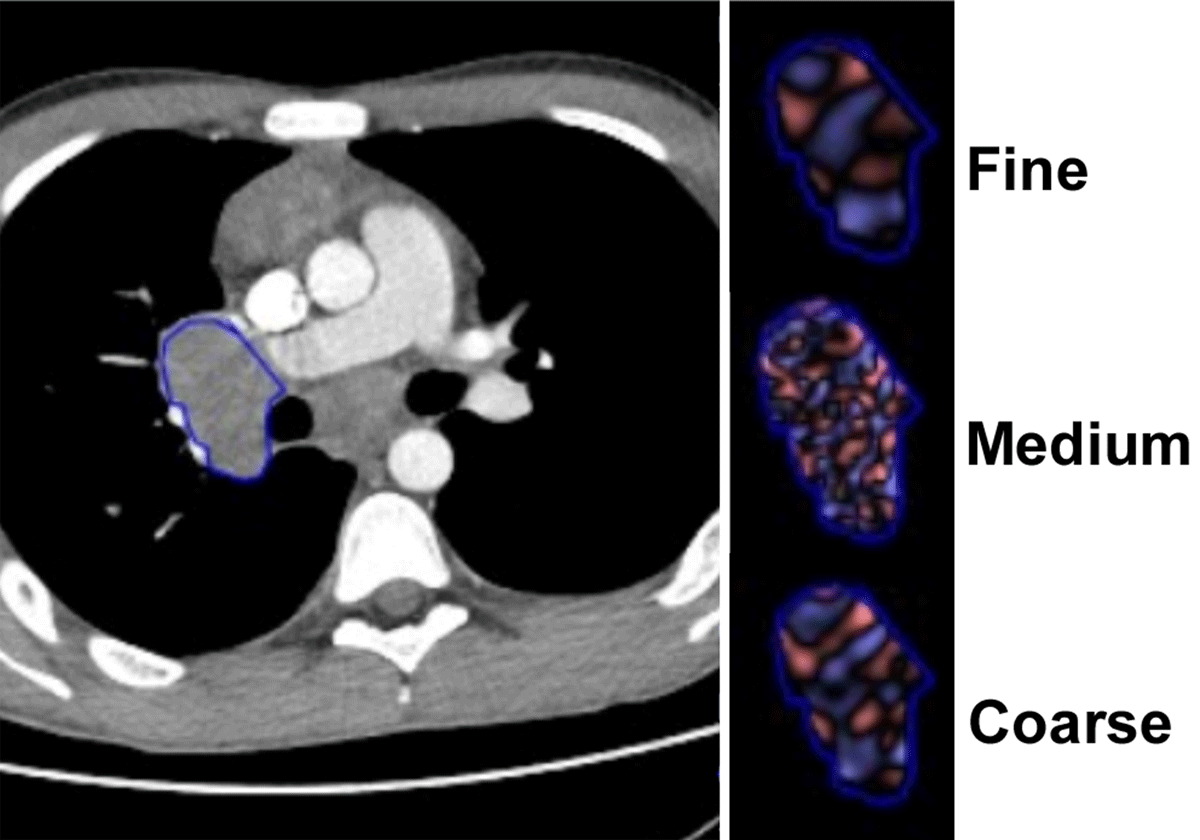
Figure 2
CT images in 15-year-old young women with Hodgkin’s lymphoma stage IV. Illustration of the pulmonary lesion delimitation, image filtration.
Table 1
Patient characteristics.
| PARAMETER | ALL PATIENTS (%) | PATIENTS WITH AR (%) | PATIENTS WITH IR (%) |
|---|---|---|---|
| TOTAL | 32 | 19 | 13 |
| Sex | |||
| Male | 15 (46.9%) | 9 (47.4%) | 6 (46.2%) |
| Female | 17 (53.1%) | 10 (52.6%) | 7 (53.8%) |
| Stage | |||
| I | 2 (6.25%) | 2 (10.5%) | 0 |
| II | 10 (31.25%) | 6 (31.6%) | 4 (30.8%) |
| III | 10 (31.25%) | 6 (31.6%) | 4 (30.8%) |
| IV | 10 (31.25%) | 5 (26.3%) | 5 (38.4%) |
| TG | |||
| 1 | 4 (12.5%) | 4 (21.1%) | 0 |
| 2 | 13 (40.6%) | 7 (36.8%) | 6 (46.2%) |
| 3 | 15 (46.9%) | 8 (42.1%) | 7 (53.8%) |
| Lesions | |||
| Lymph node | 62 (79.5%) | 35 (77.8%) | 27 (81.8%) |
| Thymus | 12 (15.4%) | 8 (17.8%) | 4 (12.1%) |
| Lung | 4 (5.1%) | 2 (4.4%) | 2 (6.1%) |
Table 2
Inter-reader agreement.
| PARAMETER ICC (INTERVAL) | SSF0 | SSF2 | SSF3 | SSF4 | SSF5 | SSF6 |
|---|---|---|---|---|---|---|
| Mean | 0.995 (0.989–0.998) | 0.791 (0.615–0.892) | 0.773 (0.52–0.86) | 0.837 (0.694–0.917) | 0.837 (0.695–0.917) | 0.849 (0.714–0.923) |
| Standard deviation | 0.884 (0.752–0.945) | 0.965 (0.93–0.983) | 0.974 (0.947–0.987) | 0.946 (0.892–0.973) | 0.923 (0.85–0.962) | 0.924 (0.851–0.962) |
| Entropy | 0.96 (0.87–0.984) | 0.942 (0.883–0.971) | 0.896 (0.799–0.947) | 0.898 (0.82–0.948) | 0.889 (0.786–0.944) | 0.827 (0.677–0.911) |
| Mean of positive pixels | 0.997 (0.994–0.999) | 0.97 (0.939–0.985) | 0.953 (0.906–0.977) | 0.981 (0.789–0.945) | 0.824 (0.672–0.91) | 0.804 (0.639–0.899) |
| Skewness | 0.637 (0.376–0.805) | 0.666 (0.42–0.821) | 0.832 (0.675–0.916) | 0.901 (0.801–0.951) | 0.84 (0.697–0.918) | 0.894 (0.794–0.947) |
| Kurtosis | 0.588 (0.31–0.774) | 0.491 (0.172–0.716) | 0.893 (0.795–0.946) | 0.863 (0.74–0.93) | 0.894 (0.794–0.947) | 0.89 (0.714–0.923) |
[i] The bottom ICCs (< 0,75) are in bold.
ICC = Intraclass Correlation Coefficient.