
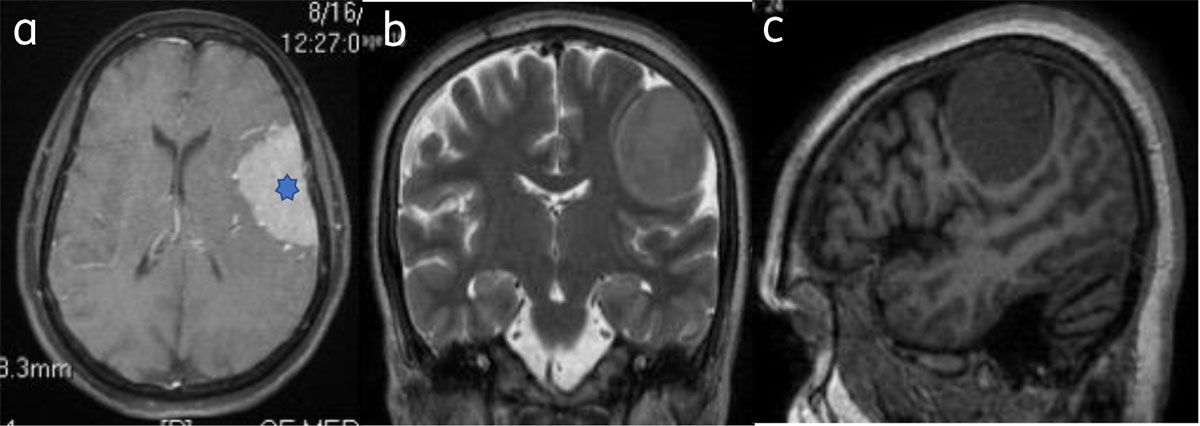
Figure 1
Classical meningioma: – (a) Axial post contrast image show enhancing broad based extra-axial lesion (star). Lesion is isointense on T2W (b) and T1W (c) to the gray matter.
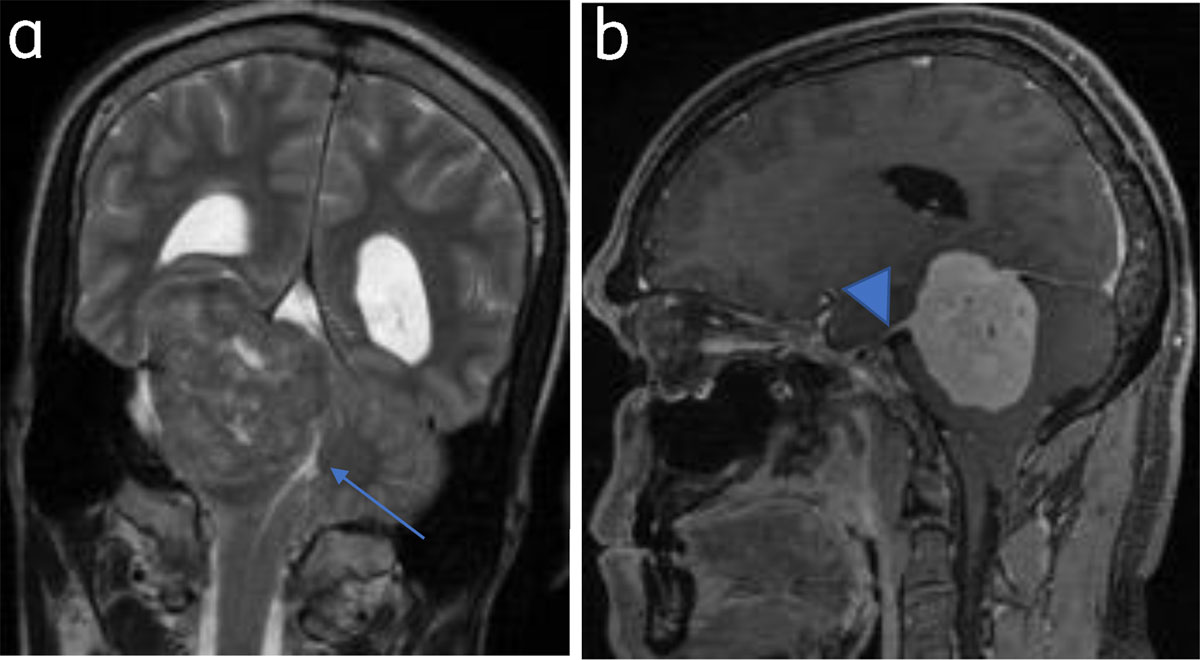
Figure 2
Tentorial meningioma with dural tail: (a) Coronal T2WI tentorial meningioma. Fourth ventricle is effaced (arrow). (b) Sagittal post contrast image shows dural tail (arrowhead).
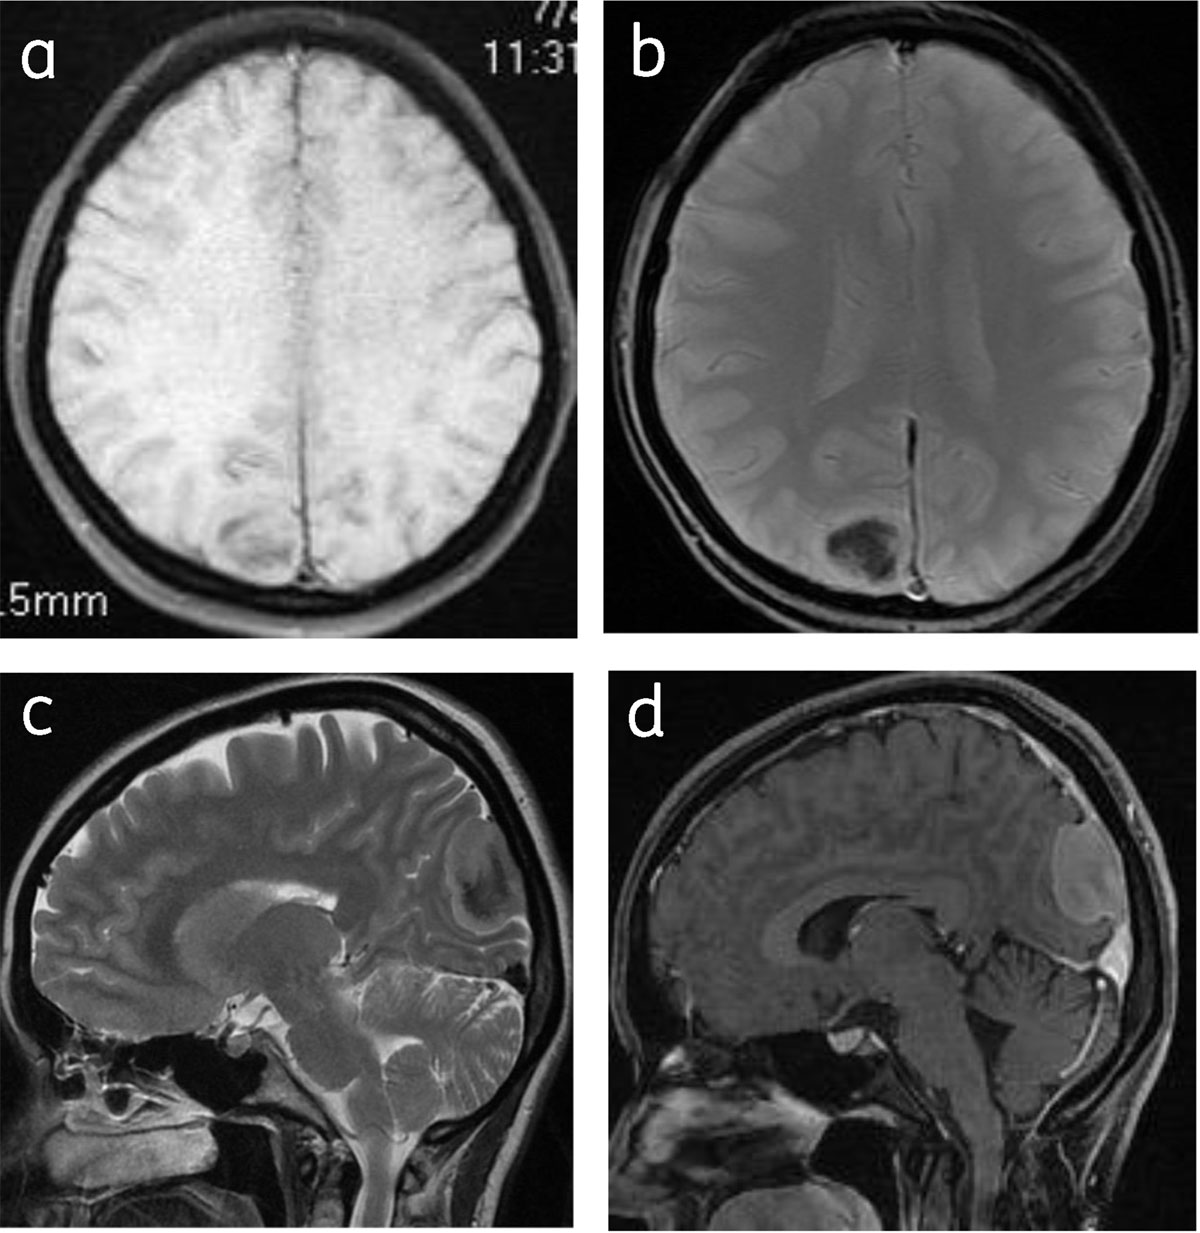
Figure 3
Calcified meningioma: Axial T1WI (a), T2* gradient (b), sagittal T2W (c) and sagittal post contrast (d) images shows right parafalcine calcified meningioma with hypointense central signal.
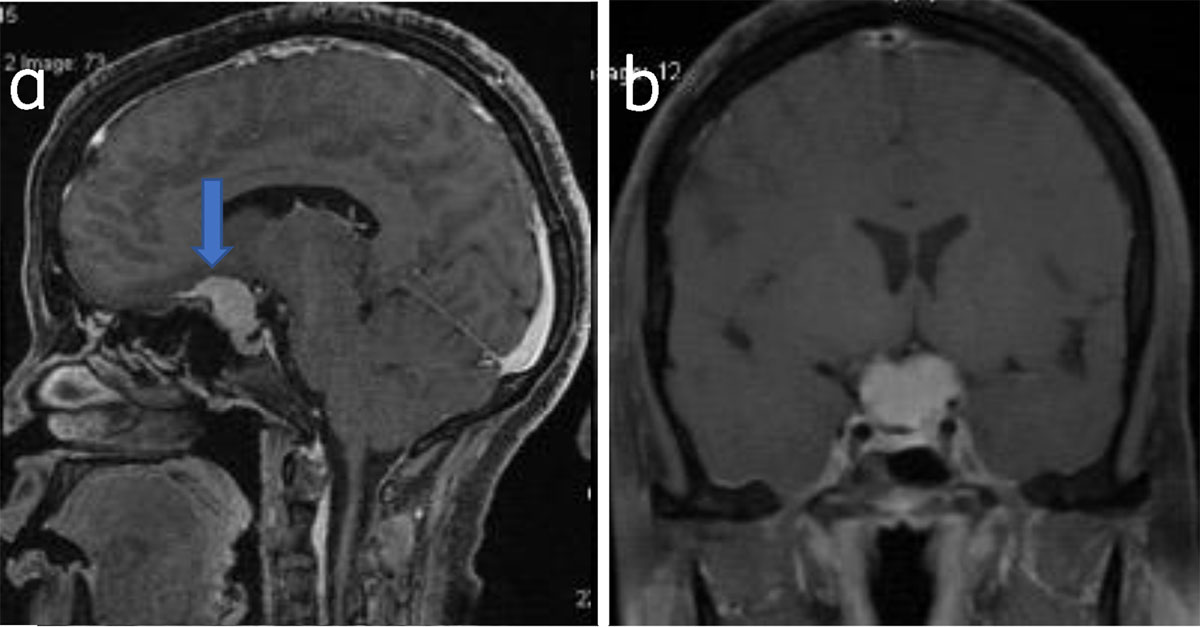
Figure 4
Suprasellar meningioma: Sagittal (a) and coronal (b) post-contrast T1W shows suprasellar meningioma (arrow).
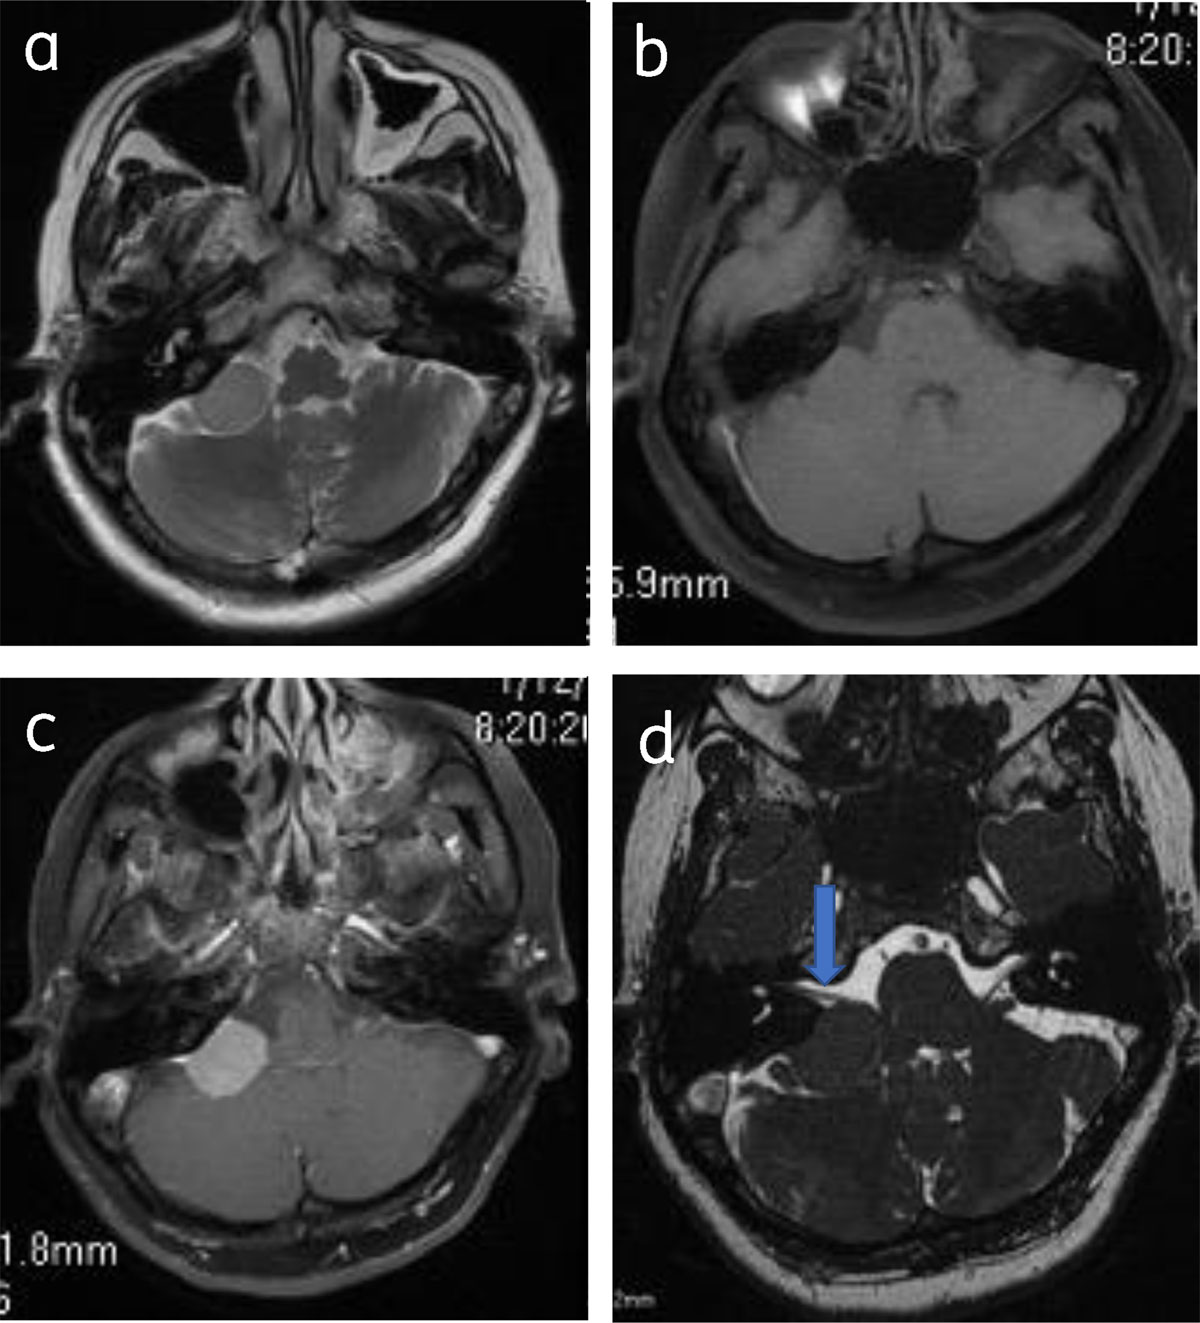
Figure 5
Cerebellopontine angle meningioma: Axial T2 (a), pre-contrast (b) and post contrast (c), show right CPA meningioma with dural tail. Axial 3DFIESTA (d) shows meningioma is indenting right VII–VIIIth nerve complex (arrow).
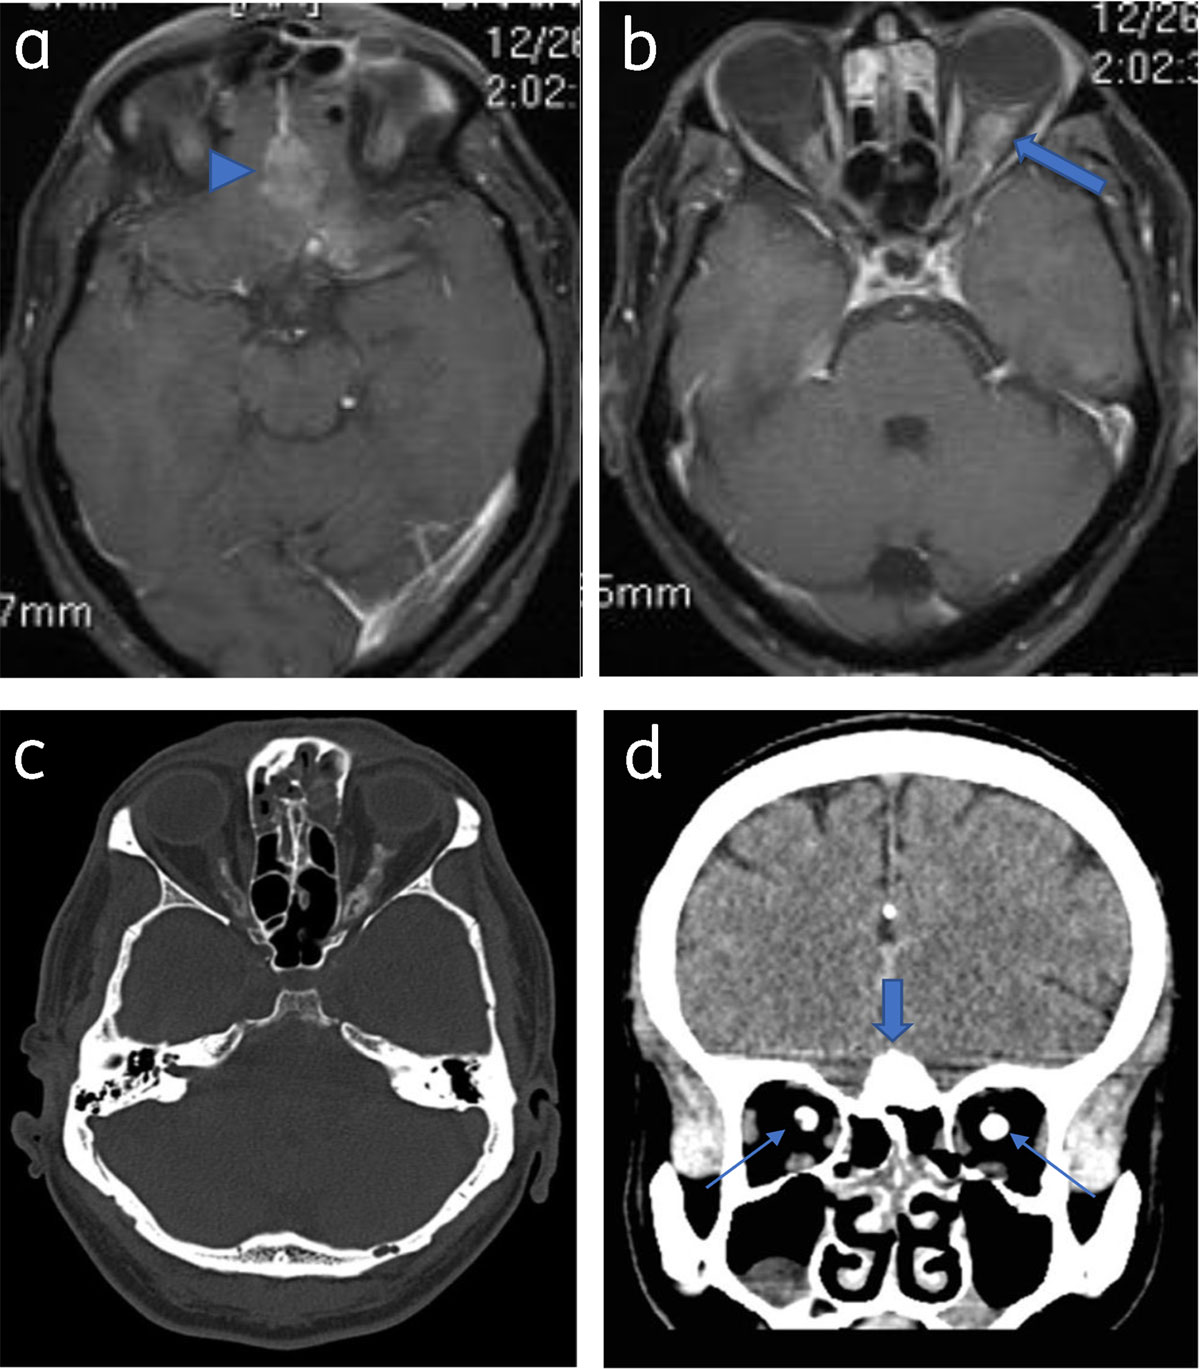
Figure 6
Optic nerve sheath meningioma and olfactory meningioma: Axial post contrast T1WI (a) and (b) shows olfactory grove meningioma (arrowhead) and bilateral optic nerve sheath meningioma (arrow). Axial (c) and coronal NCCT (d) shows calcification in the olfactory groove lesion (thick arrow) and both optic nerves (thin arrows).
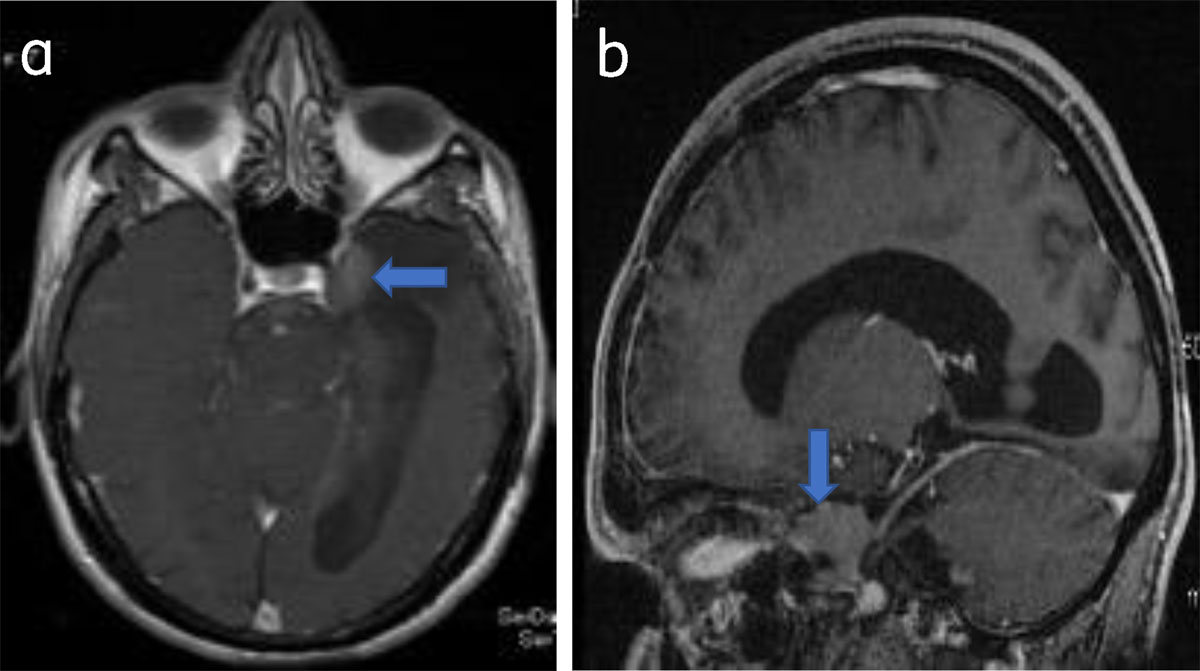
Figure 7
Parasellar meningioma: Axial (a) and sagittal (b) post-contrast T1W show a enhancing left parasellar meningioma (arrow).
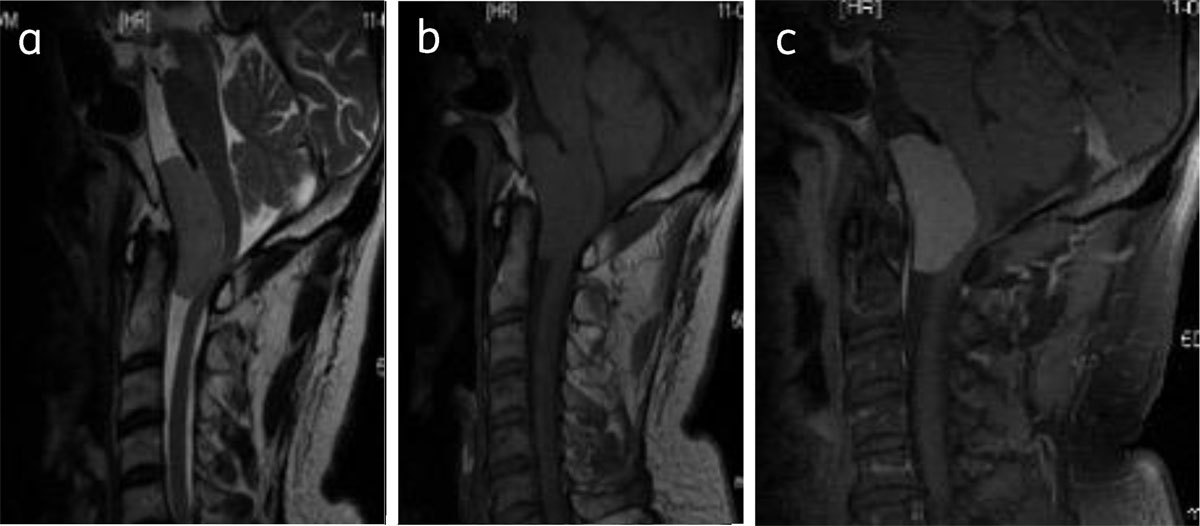
Figure 8
Clival meningioma: Sagittal T2WI (a), T1WI (b), and post contrast T1W (c) shows foramen magnum meningioma (asterisk) causing compressive myelopathy.
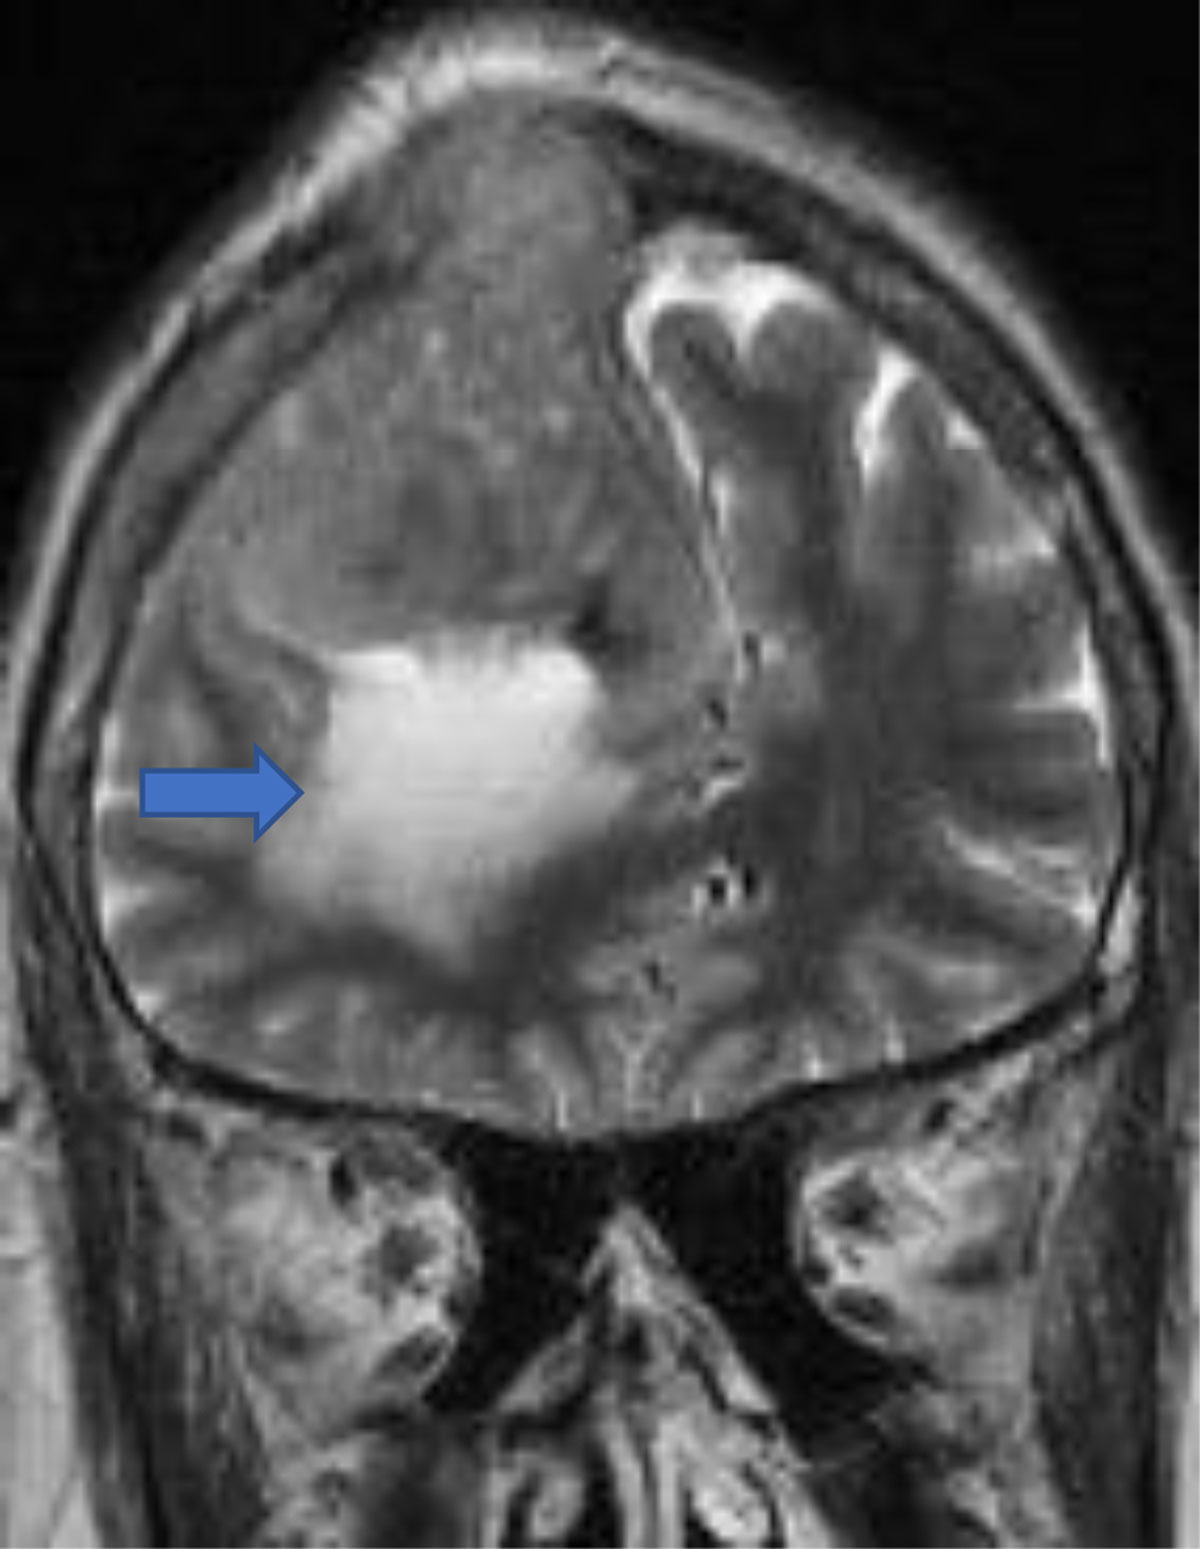
Figure 9
Convexity meningioma with peritumoral edema and (arrow) osseus invasion.
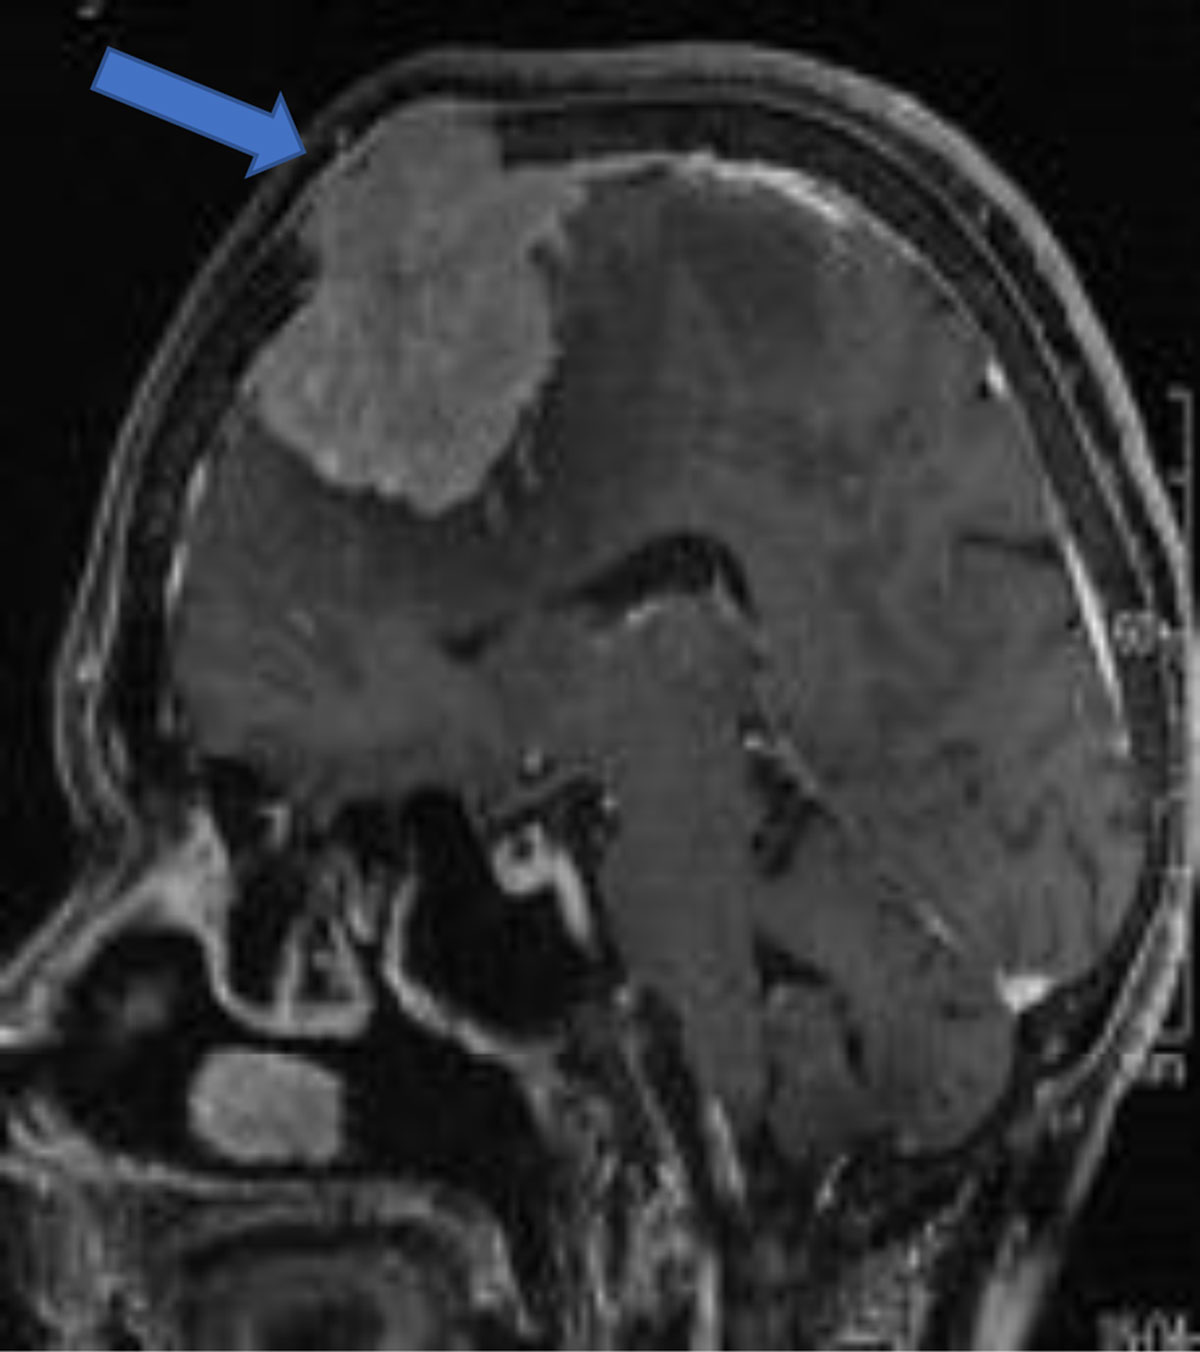
Figure 10
Sagittal post-contrast convexity meningioma with osseous invasion (arrow).
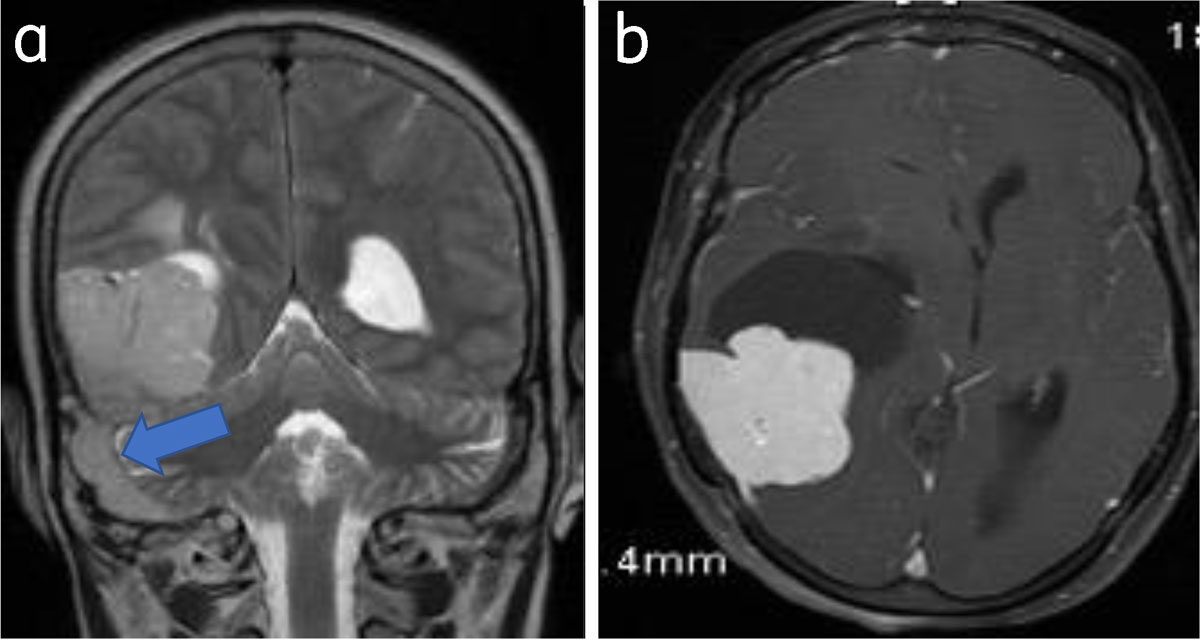
Figure 11
Meningioma with venous sinus invasion: Coronal T2WI (a) and axial (b) post-contrast images show right parieto-occipital meningioma with right sigmoid sinus invasion (arrow).
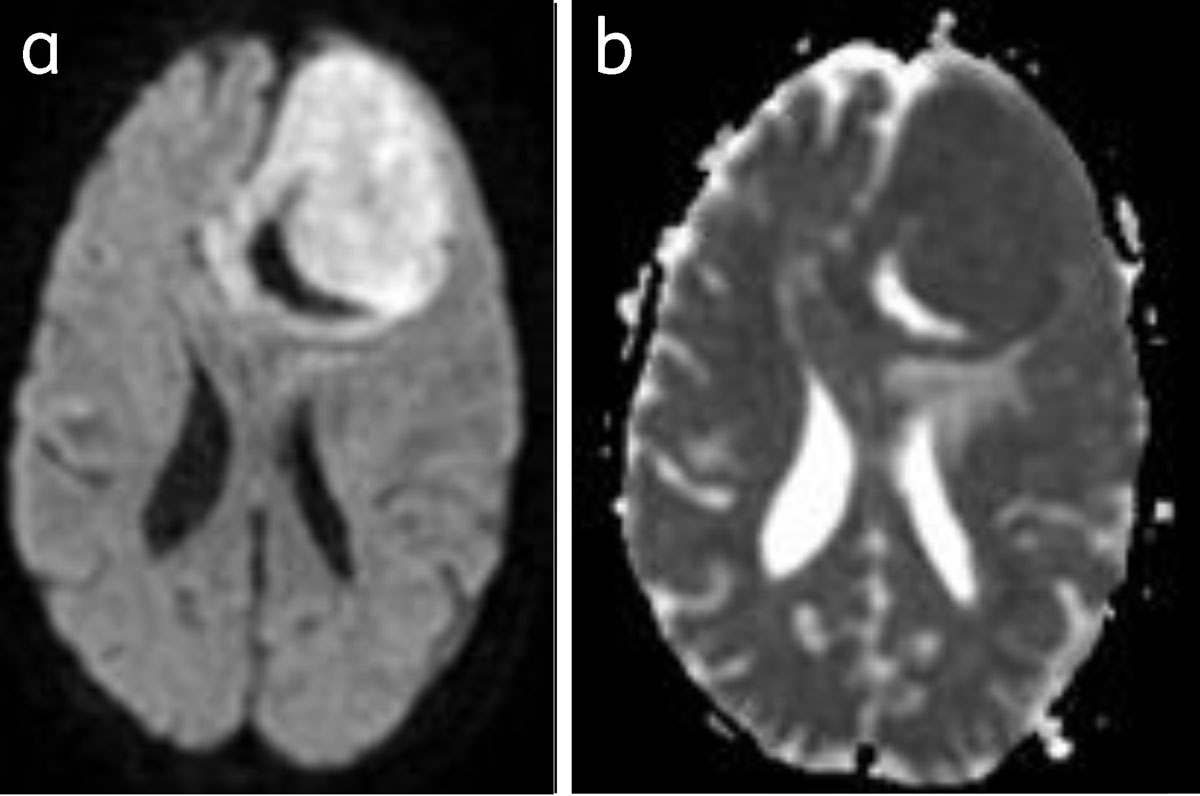
Figure 12
Meningioma with restriction of diffusion: Bright on DWI (a) and dark on ADC (b).
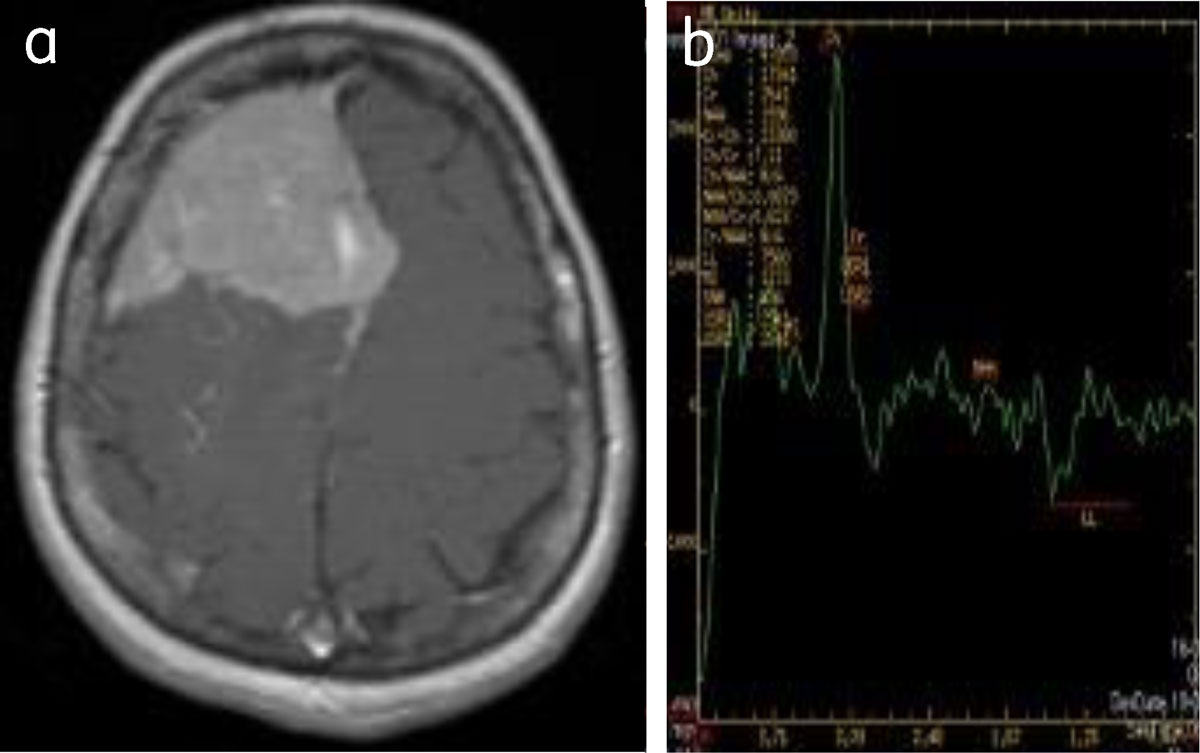
Figure 13
Convexity meningioma: (a) enhancing right frontal meningioma, (b) MRS shows choline peak with reduced NAA.
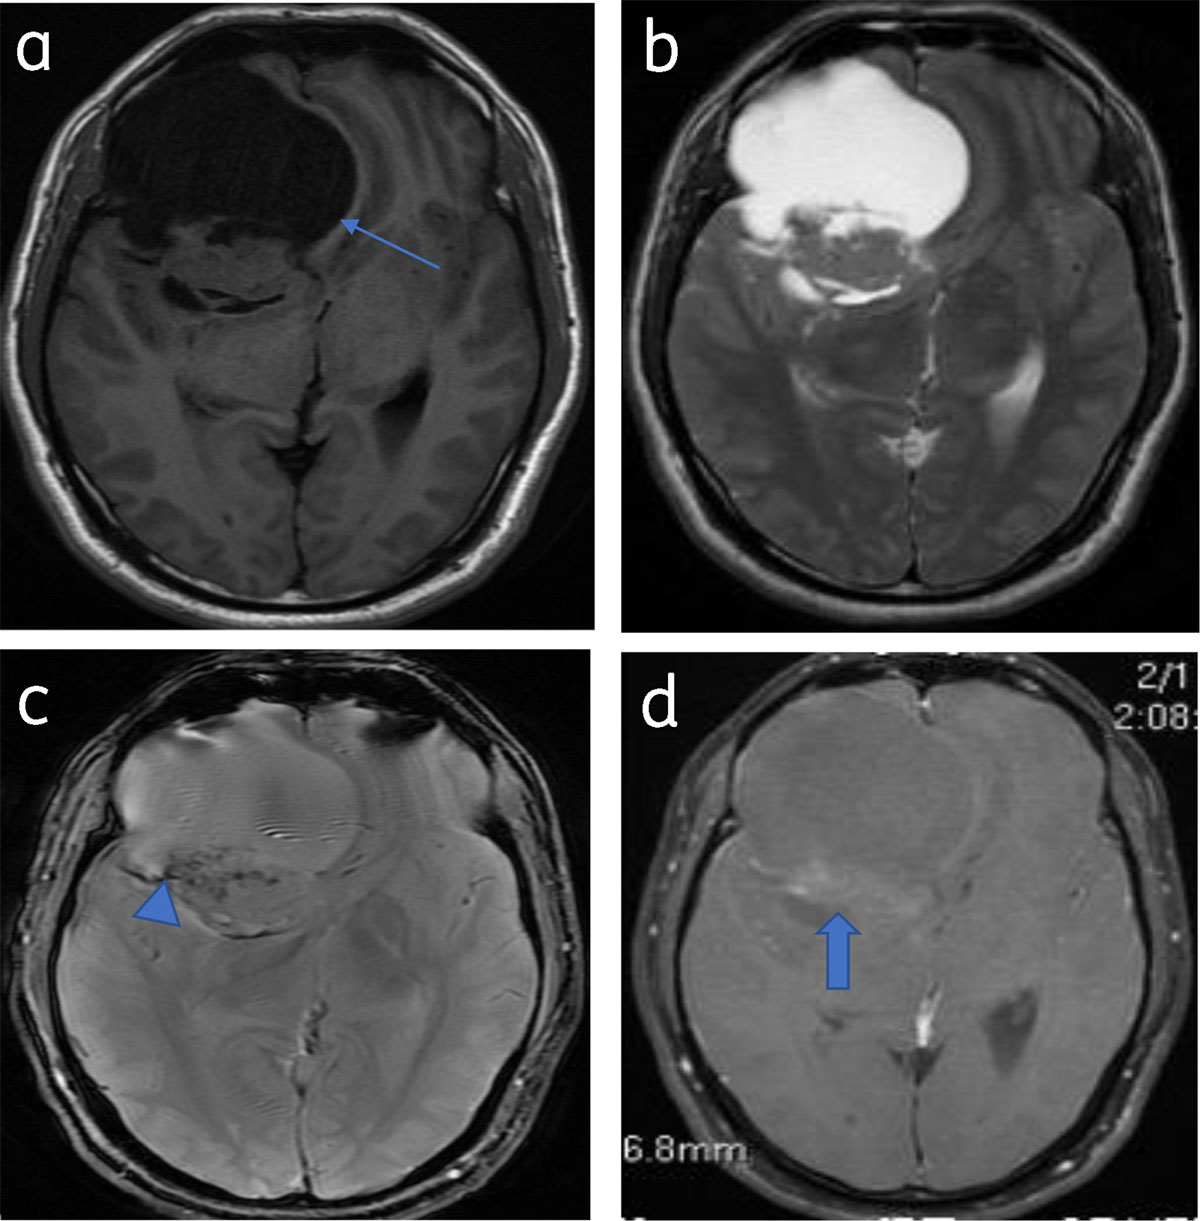
Figure 14
Predominantly cystic meningioma: Axial T1WI (a) and T2WI (b) shows right frontal meningioma with subfalcine herniation (arrow). Blooming (calcification) (arrowhead) seen on T2* image (c). Patchy enhancement of solid component (arrow) (d).
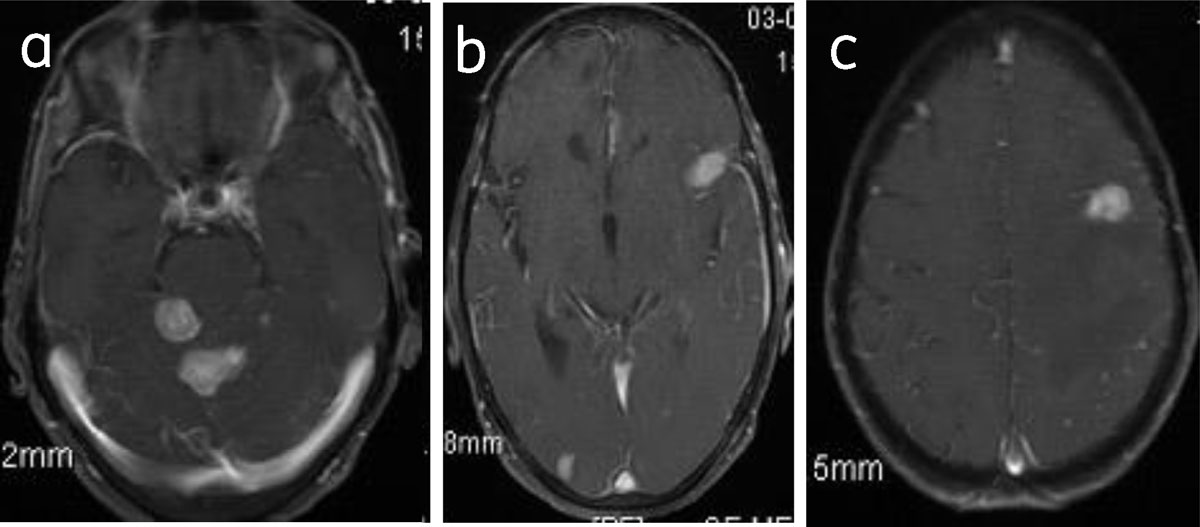
Figure 15
Meningiomatosis: Axial post-contrast (a, b, c) images show multiple enhancing meningiomas.