
Image 1
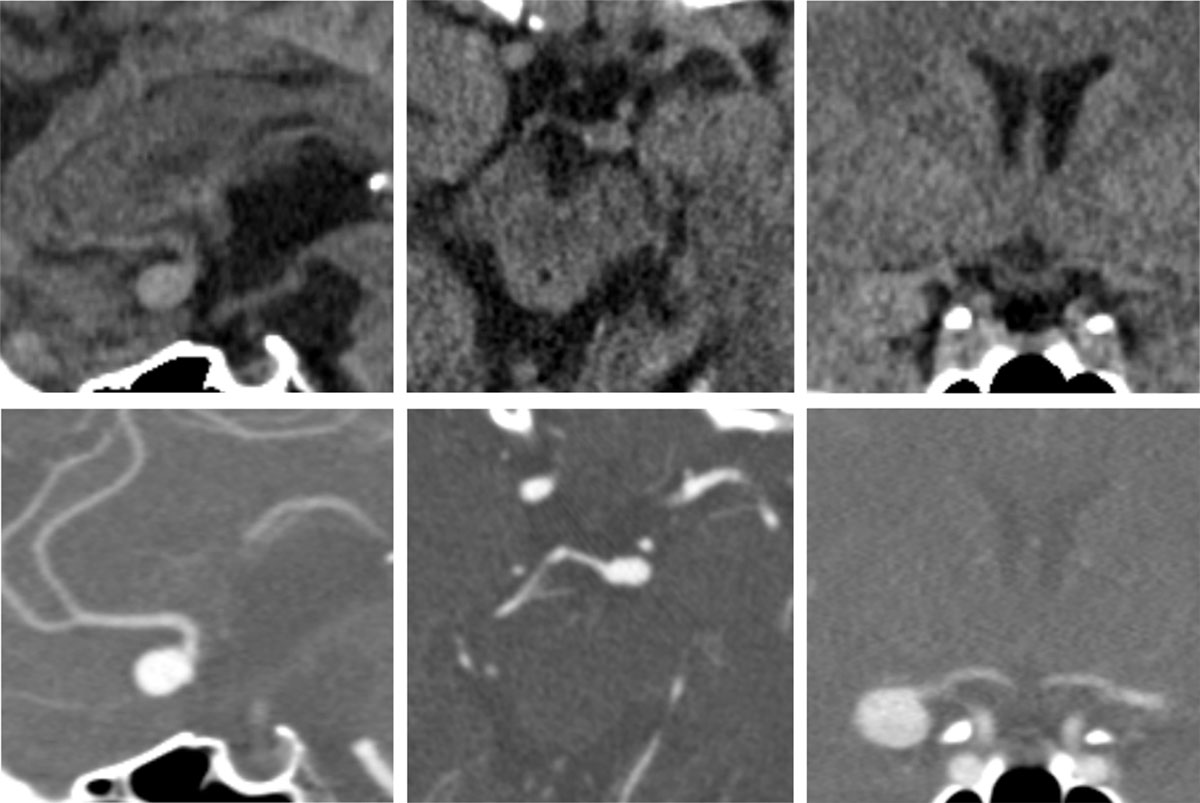
Examples of reconstructed images from the NECT datasets (upper row) and corresponding images from CT angiographies (lower row). Left: sagittal reconstruction of an aneurysm of the anterior communicating artery. Middle: axial reconstruction of an aneurysm of the basilar tip. Right: coronar reconstruction of an aneurysm of the middle cerebral artery.
Table 1
Results of the 2 × 2 tables for both passes for the whole studied group.
| SENSITIVITY | FALSE NEGATIVE RATE | SPECIFICITY | POSITIVE PREDICTIVE VALUE | FALSE DISCOVERY RATE | NEGATIVE PREDICTIVE VALUE | FALSE OMISSION RATE | |
|---|---|---|---|---|---|---|---|
| First pass | 0.66 | 0.34 | 0.88 | 1.29 | 0.15 | 0.71 | 0.28 |
| Second pass | 0.63 | 0.37 | 0.94 | 1.46 | 0.08 | 0.71 | 0.28 |
Table 2
Results of the 2 × 2 tables for both passes. The study group is subdivided in three classes with different aneurysm sizes. The intervals of the subdivision follow the different size classes of the widely used Phases score.
| FIRST PASS SENSITIVITY | FIRST PASS FALSE NEGATIVE RATE | SECOND PASS SENSITIVITY | SECOND PASS FALSE NEGATIVE RATE | |
|---|---|---|---|---|
| Size 0–6.9 mm (n = 11) | 0.09 | 0.9 | 0.027 | 0.73 |
| Size 7–9.9 mm (n = 10) | 0.8 | 0.2 | 0.7 | 0.3 |
| Size 10–20 mm (n = 12) | 0.92 | 0.08 | 0.92 | 0.08 |