Have a personal or library account? Click to login
Sclerosing Angiomatoid Nodular Transformation of the Spleen: A Diagnostic Conundrum Cover

Sclerosing Angiomatoid Nodular Transformation of the Spleen: A Diagnostic Conundrum

Open Access
|Apr 2022

Figures & Tables

Table 1

Characteristics of SANT based on a review of literature.

Age
  • Average: 44 years (range: 17–80)

Gender
  • M: 45% (26/58)/F: 55% (32/58)

Clinical findings
  • Asymptomatic: 61.1% (22/.6)

  • Left upper quadrant pain: 13.5% (5/36)

  • Nonspecific abdominal complaints: 19.4 % (7/36)

  • Right upper quadrant pain: 2.7% (1/36)

  • Fatigue: 2.7%(1/36)

Morphology
  • Lobulated: 58.6% (17/29)

  • Smooth borders: 31.0 % (9/29)

  • Central calcification: 37.9% (11/29)

  • Radiating/central scar: 31,0% (9/29)

Computed Tomography
  • Hypodense: 93.8% (45/48)

  • Isodense: 6.3% (3/48)

  • Enhancement pattern:

    • – Peripheral enhancement in the arterial phase with progressive filling in: 93% (27/29)

    • – Spoke-wheel pattern: 44% (13/29)

Magnetic Resonance Imaging
  • T1-WI

    • – Hypointense: 51.6%(17/33)

    • – Isointense: 39.3% (13/33)

    • – Hyperintense: 9.1% (3/33)

  • T2-WI

    • – Hypointense: 65.6% (21/32)

    • – Isointense: 12.5%(4/32)

    • – Hyperintense: 21.9% (7/32)

  • Enhancement pattern

    • – Peripheral enhancement in the arterial phase with progressive filling in: 79% (18/23)

    • – Spoke-wheel pattern: 48% (11/23)

    • – Central scar: 26% (6/23)

Ultrasound
  • Hypoechoic: 78.6% (11/14)

  • Isoechoic: 14.2% (2/14)

  • Hyperechoic: 7.1% (1/14)

  • Spoke-wheel enhancement pattern on CEUS: 100% (4/4)

  • Persistent peripheral enhancement on CEUS: 75% (3/4)

FDG-PET
  • Lowavidity: 42.9 % (6/14)

  • Heterogeneous avidity: 42.9 % (6/14)

  • High avidity: 14.3% (2/14)

  • Mean SUVmax: 2.8 MBq/g(range: 2.0–4.7 MBq/g)

[i] Abbreviations: M = Male; F = Female; n = number; CEUS = Contrast Enhanced Ultrasound; FDG-PET = Fluoro-deoxyglucose-Positron Emission Tomography; SUVmax = Maximal Standardized Uptake Value.
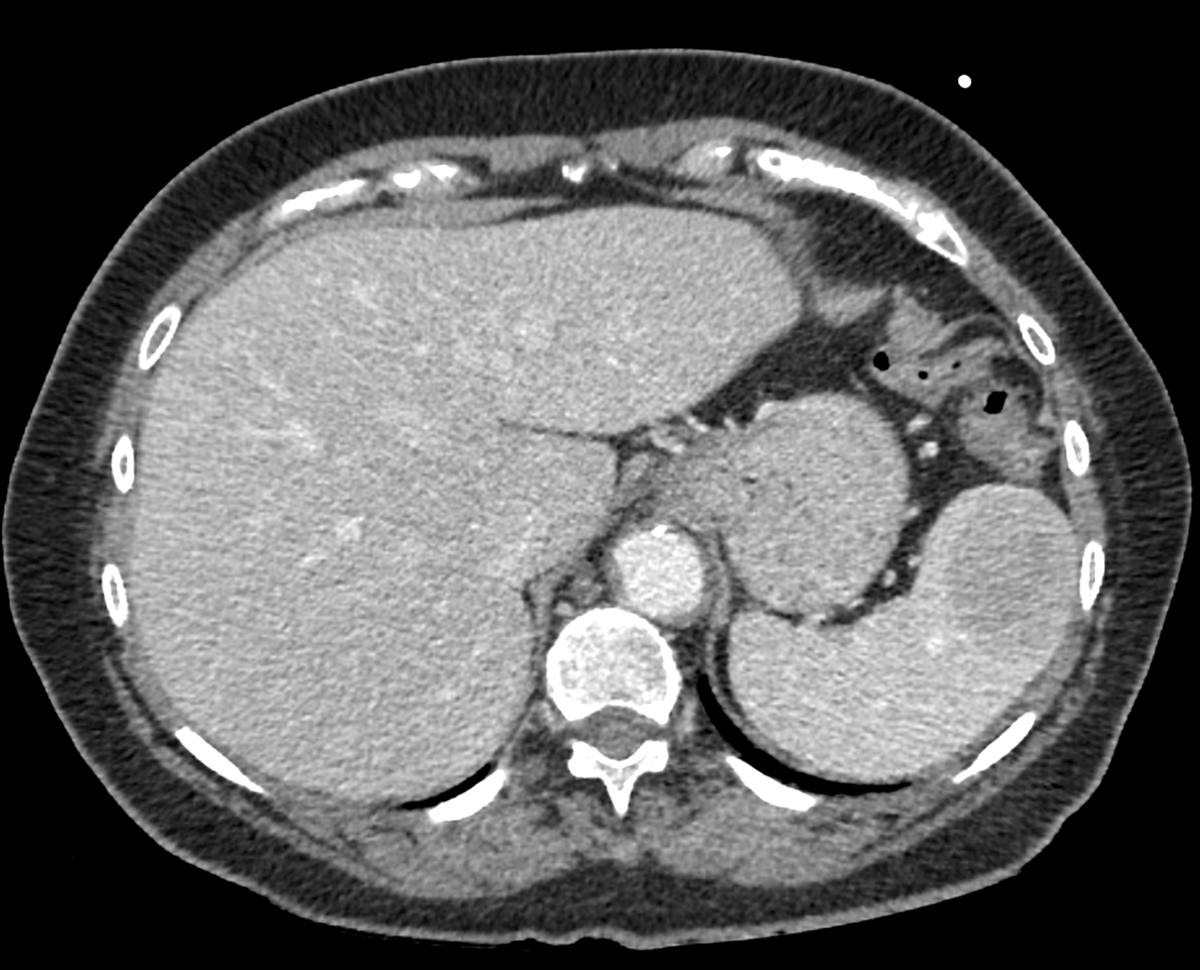
jbsr-106-1-2689-g1.png
Figure 1

Axial Computed Tomography in the porto-venous phase depicts a sharply delineated lesion anteriorly in the spleen with relative hypo-enhancement compared to the surrounding splenic parenchyma.
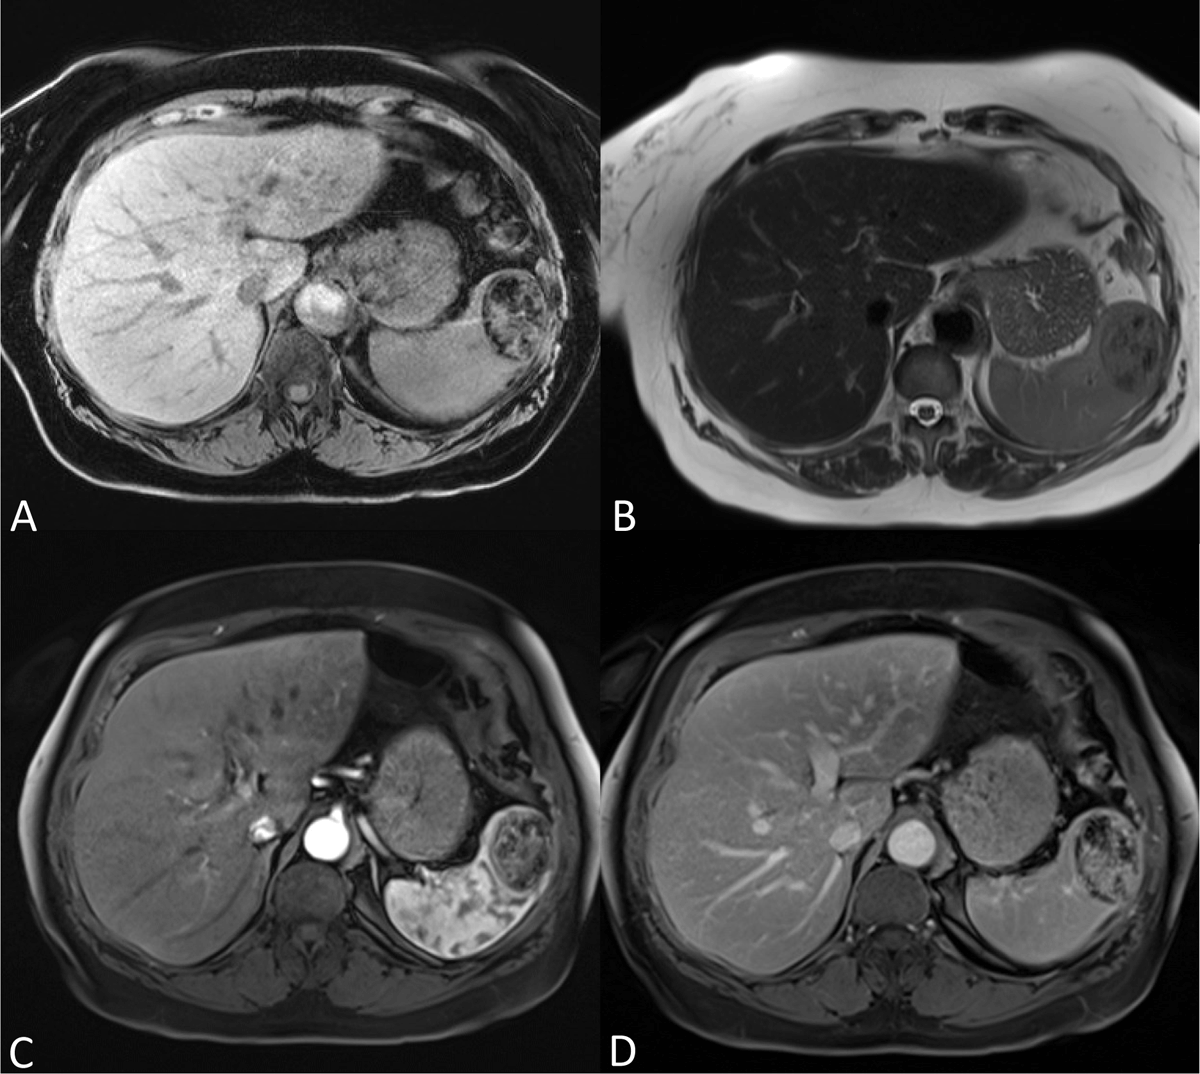
jbsr-106-1-2689-g2.png
Figure 2

(A) Unenhanced axial fat suppressed T1-weighted imaging shows the lesion is sharply delineated with abundant hypointense foci. (B) Axial T2-weighted imaging shows a sharply delineated heterogeneous mass with both iso- and hypointense components. (C–D) Axial fat suppressed T1-weighted imaging after injection of gadolinium contrast shows a relative heterogeneous and weak enhancement in the arterial phase progressively filling in at the delayed phase, although remaining heterogeneous. No central scar or spoke-wheel enhancement pattern was present.
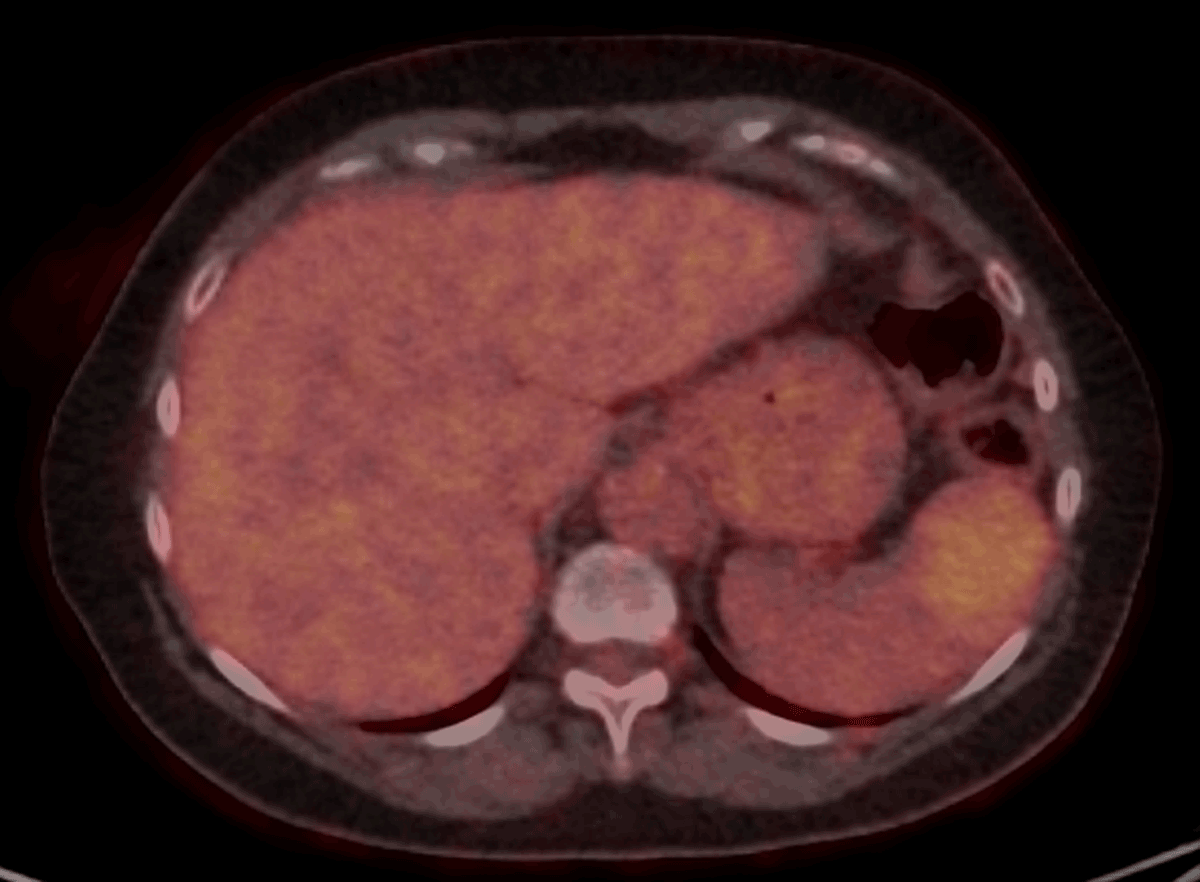
jbsr-106-1-2689-g3.png
Figure 3

Axial Fluoro-deoxyglucose-Positron Emission Tomography shows a moderate uptake in the splenic lesion. Extra-splenic lesions were absent.

DOI: https://doi.org/10.5334/jbsr.2689 | Journal eISSN: 2514-8281
Language: English
Submitted on: Oct 21, 2021
Accepted on: Feb 28, 2022
Published on: Apr 5, 2022
Published by: Ubiquity Press
In partnership with: Paradigm Publishing Services
Publication frequency: 1 issue per year

© 2022 Sander Van den Eede, Nick Van de Voorde, Filip Vanhoenacker, Bart Op de Beeck, published by Ubiquity Press
This work is licensed under the Creative Commons Attribution 4.0 License.