

Figure 1
Study flow diagram.
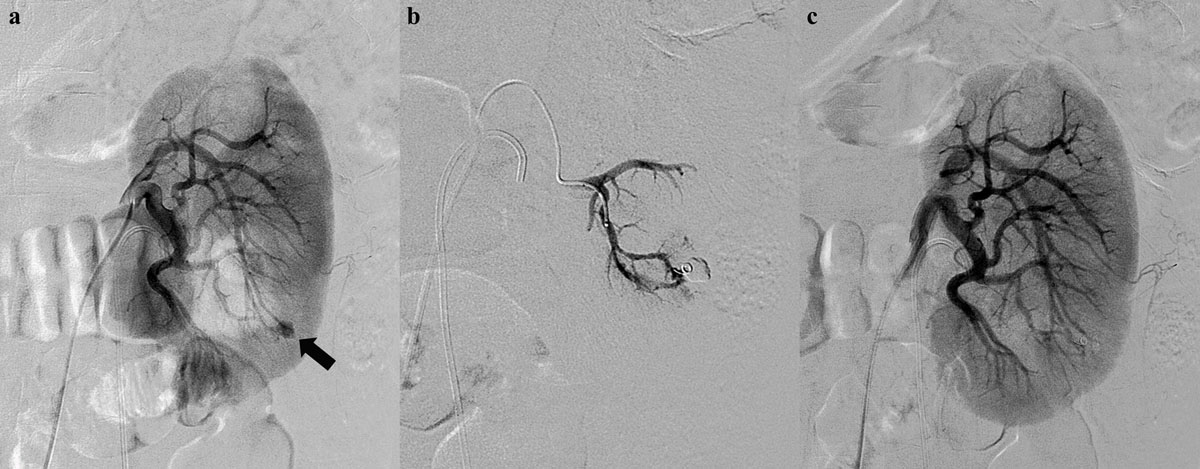
Figure 2
A 54-year-old man presenting with persistent hematuria after percutaneous nephrolithotomy. (a) An initial left renal angiogram shows a small pseudoaneurysm (black arrow) at arcuate branch of posterior segmental artery. (b) Superselective embolization of feeding artery using coaxial microcatheter system and a microcoil. (c) Postprocedural angiogram demonstrates complete devascularization of pseudoaneurysm.
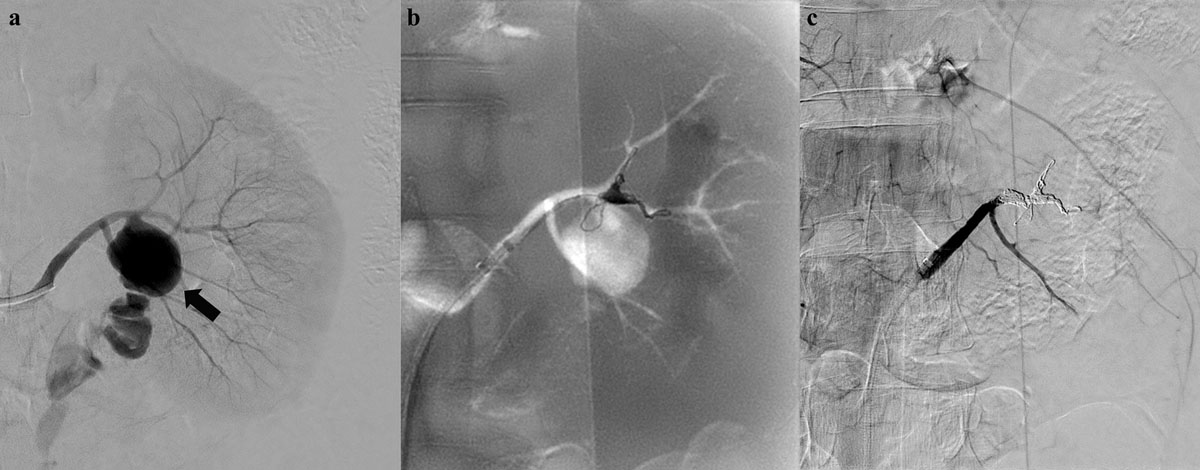
Figure 3
A 49-year-old woman presenting with acute left flank pain without trauma history. (a) An initial left renal angiogram reveals a huge pseudoaneurysm (black arrow) and contrast extravasation at proximal segment of anterior division. (b) Superselective embolization of anterior division using coaxial microcatheter system and detachable microcoils. (c) Complete cessation of active bleeding on final angiogram with preserved flow of posterior division.
Table 1
Baseline characteristics of the whole study population.
| Characteristics | Total | Group A | Group B | p-value |
|---|---|---|---|---|
| (N = 48) | (n = 25) | (n = 23) | ||
| Age | 48.40 ± 17.14 | 49.04 ± 17.82 | 47.70 ± 16.74 | 0.789 |
| Sex (male) | 29 (60.4%) | 15 (60%) | 14 (60.9%) | >0.99 |
| DM | 9 (18.8%) | 6 (24%) | 3 (13%) | 0.466 |
| SBP | 123.12 ± 17.03 | 123.20 ± 14.92 | 123.04 ± 19.41 | 0.545 |
| DBP | 74.79 ± 9.22 | 74.80 ± 8.23 | 74.78 ± 10.39 | 0.861 |
| eGFR | 81.84 ± 41.66 | 78.09 ± 42.81 | 85.92 ± 40.93 | 0.726 |
| CV/MACD | 0.37 ± 0.34 | 0.35 ± 0.33 | 0.40 ± 0.36 | 0.243 |
[i] DM: diabetes mellitus, SBP: systolic blood pressure, DBP: diastolic blood pressure.
Table 2
Indications for the procedure and embolic materials used.
| Indications | Number of procedures |
|---|---|
| Aneurysm | 1 |
| Angiomyolipoma | 17 |
| Arteriovenous malformation | 2 |
| Iatrogenic injury | 17 |
| Spontaneous kidney rupture | 6 |
| Traumatic injury | 5 |
| Embolic material | Number of procedures |
| Coil | 21 |
| Polyvinyl alcohol particles | 15 |
| N-butyl-2-cyanoacrylate | 2 |
| Multiple agents | 10 |
Table 3
Pre- and postprocedural eGFR and blood pressure.
| Total | Group A | Group B | p-value | |
|---|---|---|---|---|
| (N = 48) | (n = 25) | (n = 23) | ||
| Postprocedural AKI | ||||
| Incidence | 7 (14.6%) | 1 (4%) | 6 (26.1%) | 0.044 |
| eGFR (mL/min/1.73 m2) | ||||
| Baseline | 81.84 ± 41.66 | 78.09 ± 42.81 | 85.92 ± 40.93 | 0.726 |
| Postprocedure | 77.14 ± 36.90 | 77.54 ± 39.52 | 76.70 ± 34.70 | 0.549 |
| Mean difference | –4.70 ± 17.57 | –0.55 ± 16.98 | –9.22 ± 17.45 | 0.089 |
| p-value | 0.030 | 0.872 | 0.019 | |
| Postprocedural HTN | ||||
| Incidence | 3 (6.3%) | 0 (0%) | 3 (13%) | 0.102 |
| SBP (mmHg) | ||||
| Baseline | 123.12 ± 17.03 | 123.20 ± 14.92 | 123.04 ± 19.41 | 0.545 |
| Postprocedure | 123.31 ± 16.44 | 122.84 ± 17.49 | 123.83 ± 15.60 | 0.837 |
| Mean difference | 0.19 ± 11.79 | –0.36 ± 10.05 | 0.78 ± 13.64 | 0.751 |
| p-value | 0.913 | 0.661 | 0.786 | |
| DBP (mmHg) | ||||
| Baseline | 74.79 ± 9.22 | 74.80 ± 8.23 | 74.78 ± 10.39 | 0.861 |
| Postprocedure | 74.67 ± 11.18 | 74.92 ± 11.22 | 74.39 ± 11.39 | 0.915 |
| Mean difference | –0.12 ± 10.92 | 0.12 ± 8.86 | –0.39 ± 12.99 | 0.658 |
| p-value | 0.735 | 0.724 | 0.887 |
[i] SBP: systolic blood pressure, DBP: diastolic blood pressure.
Table 4
The logistic regression model for risk factors of AKI.
| Variables | Univariable analysis | Multivariable analysis | |||||
|---|---|---|---|---|---|---|---|
| OR | 95% CI | p-value | OR | 95% CI | p-value | VIF | |
| Age | 0.98 | 0.94–1.03 | 0.433 | ||||
| Sex (male) | 4.82 | 0.83–28.09 | 0.081 | 5.50 | 0.45–67.14 | 0.182 | 1.17 |
| DM | 4.38 | 0.78–24.66 | 0.094 | ||||
| HTN | 6.82 | 1.15–40.41 | 0.035 | ||||
| CKD | 12.14 | 1.95–75.73 | 0.008 | 35.67 | 2.22–572.50 | 0.012 | 1.58 |
| Embolization extent | 2.14 | 0.93–76.89 | 0.058 | 48.53 | 1.79–1318.57 | 0.021 | 1.75 |
| CV/MACD | 15.51 | 1.86–129.68 | 0.011 | ||||
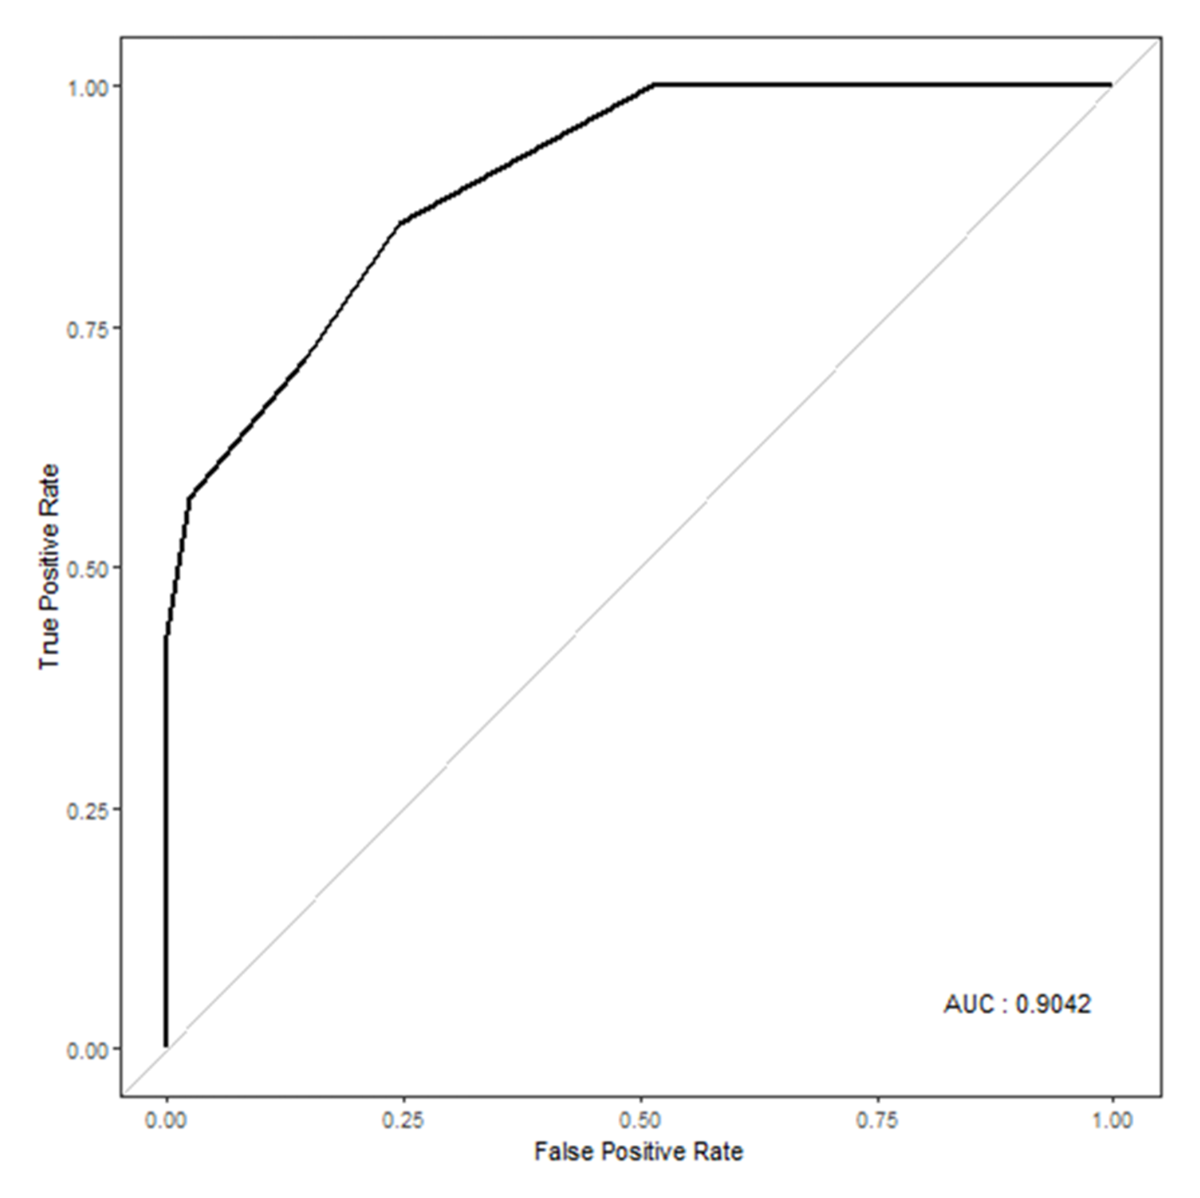
Figure 4
ROC curve for the multivariable logistic regression analysis.