
Table 1
Patient demographics and type of catheter-directed liver intervention.
| Diagnosis | Gender | Age | Liver Intervention | ||||
|---|---|---|---|---|---|---|---|
| M | F | Mean | Min-Max | Y-90 | HAIT | TACE | |
| BREAST | 0 | 9 | 56 | 46–81 | 0 | 9 | 0 |
| COLON | 7 | 3 | 53 | 44–70 | 7 | 0 | 3 |
| NEURO-ENDOCRINE | 6 | 4 | 60 | 46–70 | 5 | 0 | 5 |
[i] Y-90: resin-based yttrium-90 radioembolization.
HAIT: hepatic artery infusion therapy with 12ml of Mitomycin C.
TACE: transarterial chemoembolization with use of irinotecan-loaded microspheres.
Table 2
Image quality scores of conventional CT and cone beam CT.
| Score | Interpretation | CE-CT | DP-CBCT |
|---|---|---|---|
| 1 | Excellent contrast between tumor and liver parenchyma & sharp delineation of the metastases; | 21 | 23 |
| 2 | Excellent contrast between tumor and liver parenchyma & poor delineation of the metastases; | 3 | 1 |
| 3 | Poor contrast tumor/liver parenchyma; | 4 | 3 |
| 4 | Suboptimal image quality which required confirmation by additional imaging; | 1 | 2 |
| 5 | Inadequate/non-diagnostic. | – | – |
[i] CE-CT: contrast enhanced computed tomography (venous phase).
DP-CBCT: dual phase cone-beam computed tomography.
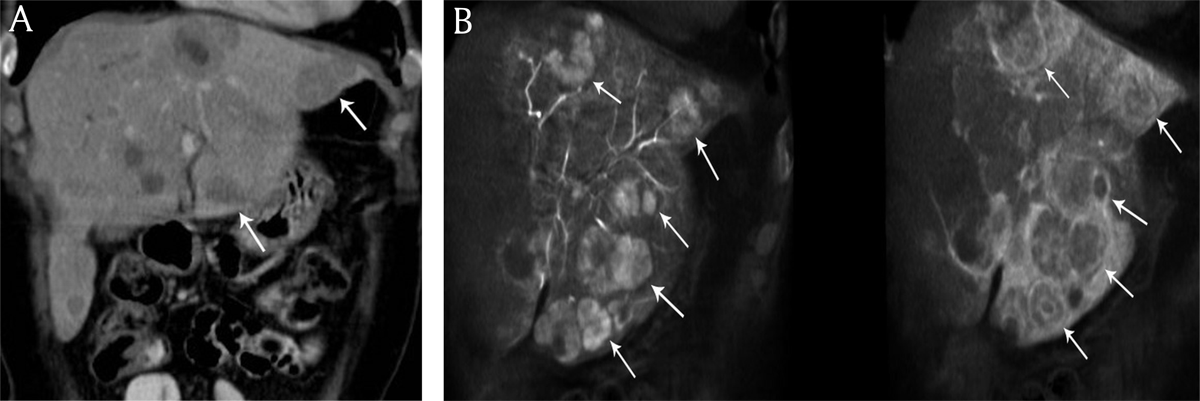
Figure 1
A) Coronal reconstructed contrast-enhanced computed tomography and B) cone beam computed tomography imaging in an 58-year-old woman presenting with bilobar neuroendocrine liver metastases. Increased number of liver metastases (white arrows) are identified on cone beam computed tomography imaging versus contrast-enhanced computed tomography.
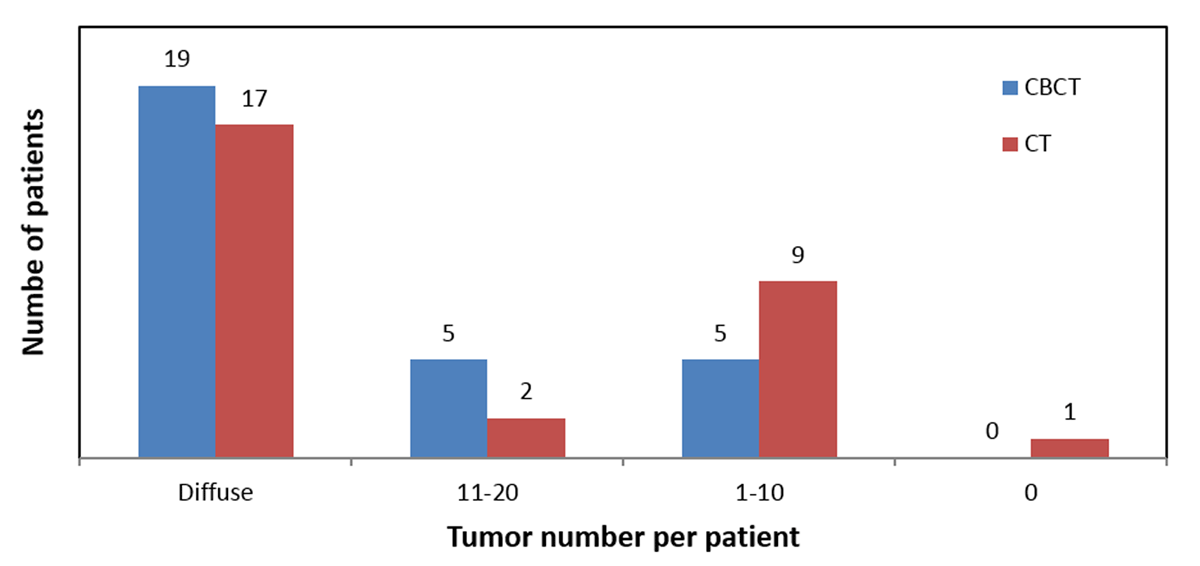
Figure 2
For the same cohort of patients, CBCT depicted more tumors per patient than CT.
Table 3
Tumor detection and classification.
| Diagnosis | No. tumors (diffuse: >20) | Largest tumor diameter (mm) | Density (hypo/hyper/iso) | Rim enhancement? (y/n) | Days between CE-CT and DP-CBCT | ||||
|---|---|---|---|---|---|---|---|---|---|
| CE-CT | DP-CBCT | CE-CT | DP-CBCT | CE-CT | DP-CBCT* | CE-CT | DP-CBCT | ||
| BREAST | 11 | 15 | 23 | 26 | hypo | hypo | y | y | 71 |
| 20 | 20 | 39 | 80 | hypo/hyper | hypo/hyper | n | y | 1 | |
| diffuse | diffuse | 25 | 24 | hypo | hypo | n | y | 1 | |
| diffuse | diffuse | 88 | 95 | hypo | hypo | n | y | 7 | |
| diffuse | diffuse | 68 | 73 | hypo | hypo | n | n | 11 | |
| diffuse | diffuse | 17 | 24 | hypo | hypo | mixed | y | 25 | |
| diffuse | diffuse | 45 | 67 | hypo/hyper | hypo/iso | y | y | 6 | |
| diffuse | diffuse | 44 | 72 | hypo | hypo | mixed | y | 8 | |
| diffuse | diffuse | not countable | not countable | hypo | hypo | n | y | 5 | |
| COLON | 0 | 6 | not detected | 15 | not detected | hyper | not detected | y | 16 |
| 2 | 1 | 65 | 72 | hypo | hypo | mixed | y | 18 | |
| 4 | 8 | 30 | 57 | hypo | hypo/hyper | n | y | 28 | |
| 5 | 8 | 18 | 23 | hypo | hyper; one hypo dense | n | y | 14 | |
| 6 | 17 | 56 | 73 | hypo | hypo | y | y | 15 | |
| 7 | 11 | 35 | 33 | hypo | hypo | y | y | 15 | |
| 7 | diffuse | 29 | 40 | hypo | hypo(v); hypo/hyper (a) | n | y | 53 | |
| 10 | diffuse | 96 | 108 | hypo | hypo | n | y | 82 | |
| 10 | 11 | 33 | 82 | hypo | hypo | n | y | 147 | |
| diffuse | diffuse | 27 | 29 | hypo | hypo | n | y | 33 | |
| NEURO-ENDOCRINE | 4 | 3 | 90 | 103 | hypo/hyper | hypo/hyper | y | y | 53 |
| diffuse | diffuse | 73 | 68 | hypo | hypo | n | n | 8 | |
| diffuse | diffuse | 54 | 54 | hypo | hyper | n | y | 85 | |
| diffuse | diffuse | 50 | 52 | hypo/iso | hyper (v); hypo/iso (a) | n | y | 39 | |
| diffuse | diffuse | 40 | 44 | hypo | hypo/iso | n | y | –1 | |
| diffuse | diffuse | 30 | 34 | hypo/iso | hyper | n | n | 3 | |
| diffuse | diffuse | 41 | 47 | hyper/hypo | hypo | y | y (a) | 18 | |
| diffuse | diffuse | 31 | 36 | hypo (a); iso (v) | hypo(v); hyper (a) | n | y | 91 | |
| diffuse | diffuse | 53 | 62 | iso/hypo | hypo(v); hyper (a) | y | y | 1 | |
| diffuse | diffuse | 46 | 56 | hypo | hypo | y | y | 6 | |
[i] * venous phase.
hypo: hypodense.
hyper: hyperdense.
iso: isodense.
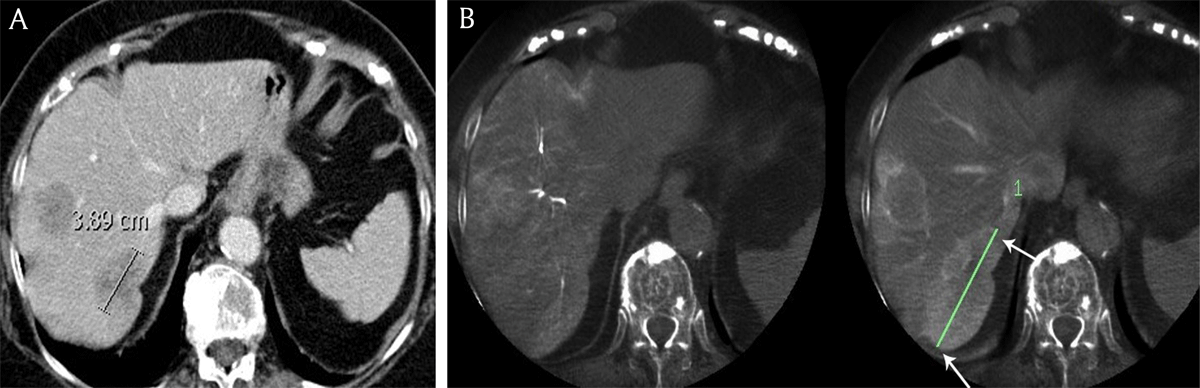
Figure 3
A) Contrast-enhanced computed tomography and B) cone beam computed tomography in an 81-year-old female patient with breast cancer liver metastases demonstrates the longest diameter of the largest metastasis (white arrows), measuring respectively 3.9 cm and 7.9 cm.
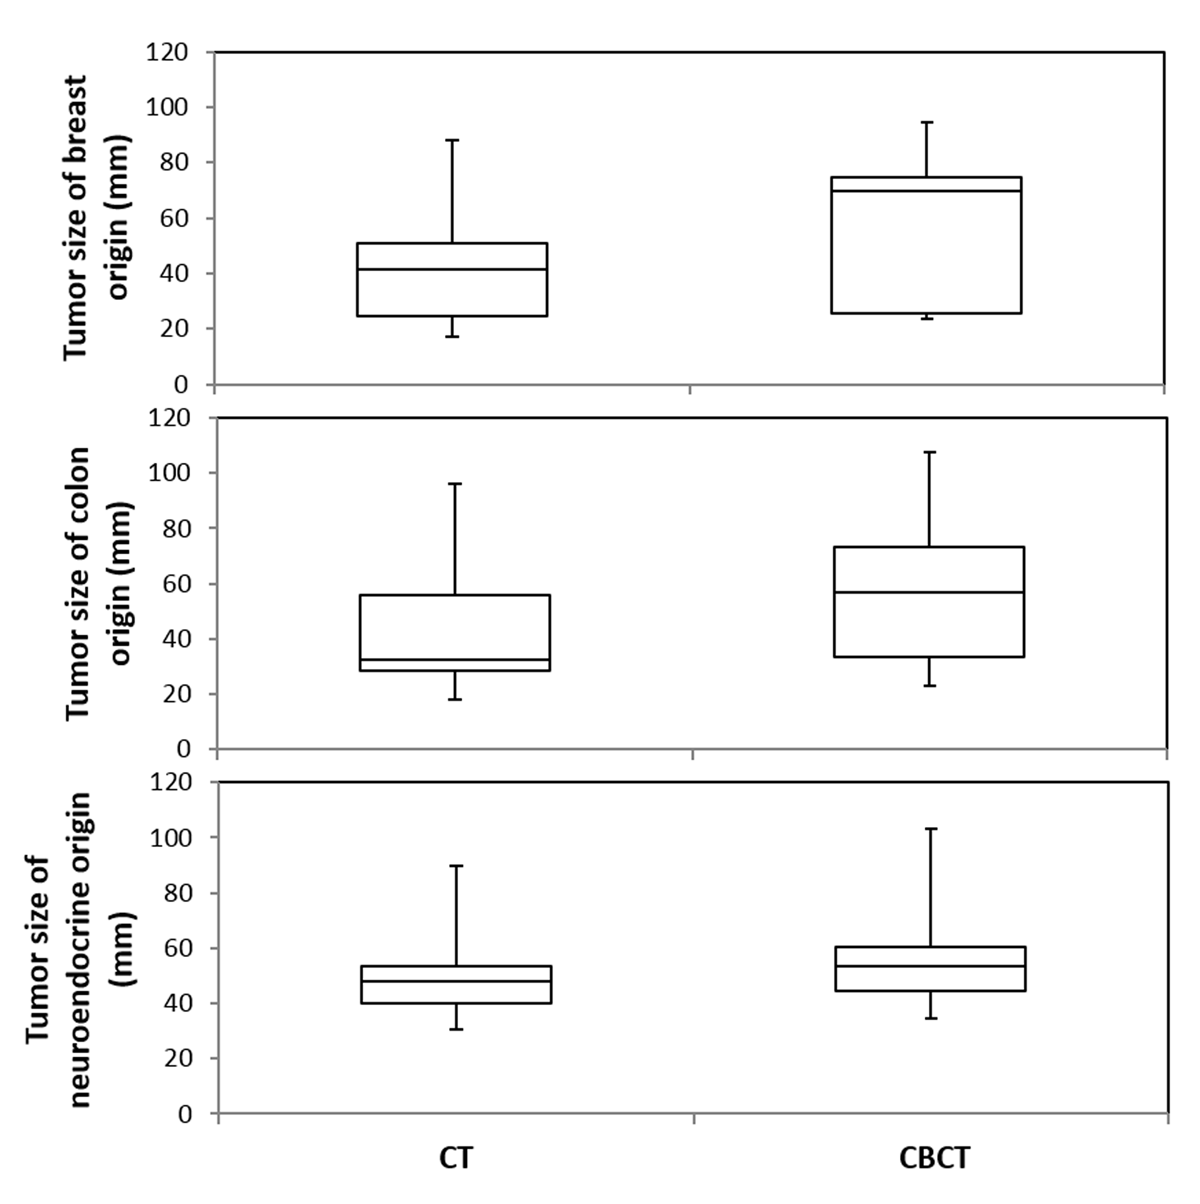
Figure 4
DP-CBCT detected significantly larger tumor diameters compared to CE-CT, regardless of the tumor origin (breast, p = 0.03; colon, p = 0.03; neuroendocrine, p = 0.01). Box and whisker plots of the maximum tumor diameter where, for each plot, the top-most value of the whisker represents the maximum tumor diameter, followed by the third quartile range (top box), median value (at division of boxes), first quartile range (bottom box), and minimum value at bottom-most end of whisker. The distribution of values for tumors of breast and colon origin is equally different between CBCT and CT; there is a smaller difference amongst tumors of neuroendocrine origin.
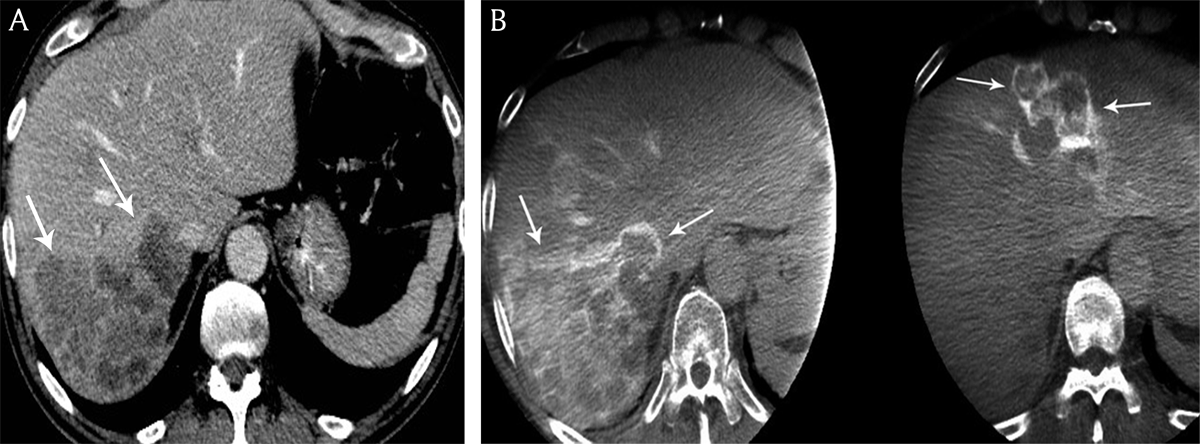
Figure 5
A) Contrast-enhanced computed tomography and B) cone beam computed tomography in a 68-year-old man presenting with bilobar colon cancer liver metastases. Contrast-enhancement of the peripheral tumoral rim is hyperdense to the residual liver parenchyma on cone beam computed tomography versus contrast-enhanced computed tomography.