
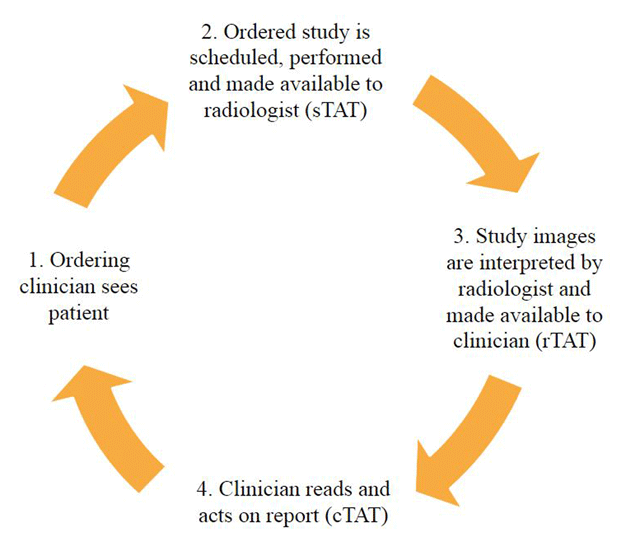
Figure 1
Diagram showing the sequence of events from when a clinician orders an imaging study to when the clinician reads the study.
Table 1
Demographics.
| Weekend-Weekday (N = 131) | Weekend-Weekend (N = 157) | Weekday-Weekday (N = 1477) | P-value1 | P-value2 | P-value3 | |
|---|---|---|---|---|---|---|
| Patient age in years (SD) [median] | 47.34 (16.7) [46.0] | 47.52 (17.6) [49.0] | 49.87 (16.3) [51.0] | 0.929 | 0.098 | 0.111 |
| Sex (% male) | 51 (38.9%) | 66 (42.0%) | 606 (41.0%) | 0.631 | 0.711 | 0.799 |
| MRI type | 0.051 | 0.117 | <0.001 | |||
| Ankle | 12 (9.2%) | 15 (9.6%) | 163 (11.0%) | |||
| Cervical spine | 12 (9.2%) | 5 (3.2%) | 136 (9.2%) | |||
| Elbow | 7 (5.3%) | 10 (6.4%) | 102 (6.9%) | |||
| Foot | 17 (13.0%) | 22 (14.0%) | 130 (8.8%) | |||
| Hand | 3 (2.3%) | 6 (3.8%) | 50 (3.4%) | |||
| Hip | 14 (10.7%) | 26 (16.6%) | 120 (8.2%) | |||
| Lumbar spine | 15 (11.5%) | 9 (5.7%) | 135 (9.1%) | |||
| Pelvis | 17 (13.0%) | 8 (5.1%) | 126 (8.5%) | |||
| Knee | 6 (4.6%) | 16 (10.2%) | 94 (6.4%) | |||
| Shoulder | 6 (4.6%) | 13 (8.3%) | 148 (10.0%) | |||
| Thoracic spine | 16 (12.2%) | 15 (9.6%) | 133 (9.0%) | |||
| Wrist | 6 (4.6%) | 8 (5.1%) | 140 (9.5%) | |||
| Ordering clinician specialty | 0.005 | 0.012 | 0.006 | |||
| Emergency Medicine | 2 (1.6%) | 8 (5.7%) | 34 (2.3%) | |||
| Family Medicine | 8 (6.4%) | 25 (17.7%) | 141 (9.5%) | |||
| Internal Medicine | 52 (41.6%) | 56 (39.7%) | 645 (43.7%) | |||
| Orthopedics | 30 (24.0%) | 34 (24.1%) | 445 (30.1%) | |||
| PMR | 22 (17.6%) | 11 (7.8%) | 129 (8.7%) | |||
| General Surgery | 11 (8.8%) | 7 (5.0%) | 83 (5.6%) |
[i] PMR – Physical Medicine and Rehabilitation.
SD – Standard deviation.
Table 2
Turnaround times by the day of week the study was performed and interpreted by the radiologist (weekday versus weekend).
| Weekend-Weekday (N = 131) | Weekend-Weekend (N = 157) | Weekday-Weekday (N = 1477) | P-value1 | P-value2 | P-value3 | |
|---|---|---|---|---|---|---|
| Radiologist turnaround time (rTAT) in days (median) | 2.5 | 0.8 | 0.13 | <0.001 | <0.001 | <0.001 |
| Clinician turnaround time (cTAT) in days (median) | 0.3 {106/131} | 1.9 {99/157} | 0.6 {1171/1477} | <0.001 {0.001} | 0.449 {0.736} | <0.001 {<0.001} |
| Provider turnaround time (pTAT) in days (median) | 2.8 | 2.8 | 0.9 | 0.750 | <0.001 | <0.001 |
[i] Number of referring clinicians that read the report/Number of reports.
P-values
No brackets – P-value from Wilcoxon-Rank sum test.
{} – P-value comparing proportion of referring clinicians that read reports.
1 P-value from test comparing weekend-weekday studies to weekend-weekend studies.
2 P-value from test comparing weekend-weekday studies to weekday-weekday studies.
3 P-value from test comparing weekend-weekend studies to weekday-weekday studies.
Table 3
Clinician turnaround time (cTAT) in days by ordering clinician specialty.
| Weekend-Weekday (N = 131) | Weekend-Weekend (N = 157) | Weekday-Weekday (N = 1479) | P-value1 | P-value2 | P-value3 | |
|---|---|---|---|---|---|---|
| Emergency Medicine (N=) | 28.4 (39.9) [11.22] | 2.29 (2.3) [1.58] | 14.90 (57.3) [0.23] | 0.374 [0.700] | 0.633 [0.389] | 0.276 [0.429] |
| Family Medicine (N=) | 2.01 (4.07) [0.14] | 35.06 (142.2) [1.71] | 25.88 (106.2) [0.58] | 0.277 [0.008] | 0.012 [0.377] | 0.770 [0.019] |
| Internal Medicine (N=) | 3.49 (7.93) [0.13] | 19.97 (73.8) [1.89] | 11.11 (50.19) [0.63] | 0.346 [<0.001] | 0.009 [0.059] | 0.610 [0.002] |
| Orthopedics (N=) | 28.96 (120.3) [0.65] | 31.88 (87.87) [2.58] | 8.72 (44.72) [0.29] | 0.896 [0.025] | 0.275 [0.009] | 0.089 [<0.001] |
| PMR (N=) | 70.07 (198.1) [1.82] | 1.51 (1.08) [1.48] | 30.02 (109.1) [0.74] | 0.330 [0.776] | 0.565 [0.116] | 0.005 [0.470] |
| General Surgery (N=) | 41.65 (92.5) [0.02] | 0.96 (0.97) [0.82] | 12.92 (50.8) [0.80] | 0.381 [0.571] | 0.528 [0.336] | 0.050 [0.829] |
[i] Means (Standard Deviations).
[Medians]{Proportions of referring clinicians that read report}.
P-values
No brackets – P-value from t-test with unequal variances comparing means.
[] – P-value from Wilcoxon-Rank sum test.
{} – P-value comparing proportion of referring clinicians that read reports.