
Table 1
Response rates of the surveyed groups.
| Surveyed Group | Number of invitations | Number of responders | Response Rate |
|---|---|---|---|
| Graduates 2018 | 46 | 23 | 50% |
| Graduates 2013–2018 | 225 | 89 | 40% |
| Heads of non-university departments | 84 | 39 | 46% |
| Heads of university departments | 7 | 5 | 71% |
Table 2
Results of the survey of the radiologists graduated in 2018. UA: Universiteit Antwerpen. VUB: Vrije Universiteit Brussel, UGent: Universiteit Gent, KUL: Katholieke Universiteit Leuven, UCL: Université Catholique Louvain, ULC: Université Libre Bruxelles, ULiège, Université de Liège.
| UA | VUB | UGENT | ULIÈGE | UCL | ULB | KUL | |
|---|---|---|---|---|---|---|---|
| AT WHICH UNIVERSITY HAVE YOU JUST GRADUATED? | 8.7% | 8.7% | 17.4% | 17.4% | 17.4% | 4.4% | 26.0% |
| I have started as a staff member in a radiology association | I have found a position as a staff member, but I am doing a fellowship or extra training before I start there | I am doing a fellowship while searching for a staff member position | I am unemployed for the moment | Other | |||
| What kind of job have you started since your graduation | 50% | 8.3% | 37.5% | 4.2% | 0% | ||
| Yes | No | No preference | |||||
| If you have found a permanent position in an association, is this in the region you initially wanted to work? | 73% | 14 % | 13% | ||||
| University Hospital | Non-University Hospital | Private practice | Hospital abroad | Other | |||
| If you have found a job as a staff member, is this in a: | 27% | 52% | 7% | 7% | 7% | ||
| University Hospital | Non-University Hospital | Other | |||||
| If you are doing a fellowship, is this in a: | 27.3% | 63.6% | 9.1% |
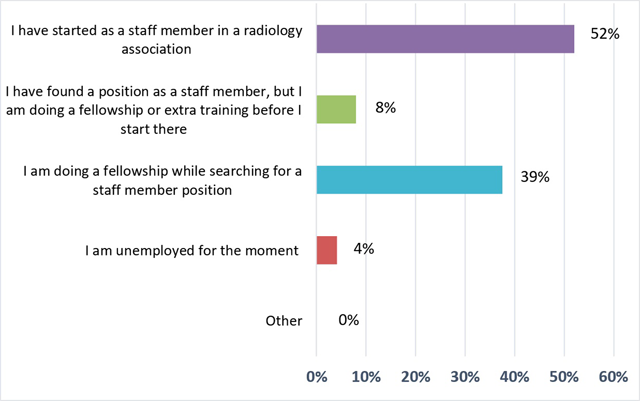
Figure 1
‘What kind of job will you start or have you started since your graduation?’ Results from the survey sent to the graduates of 2018.
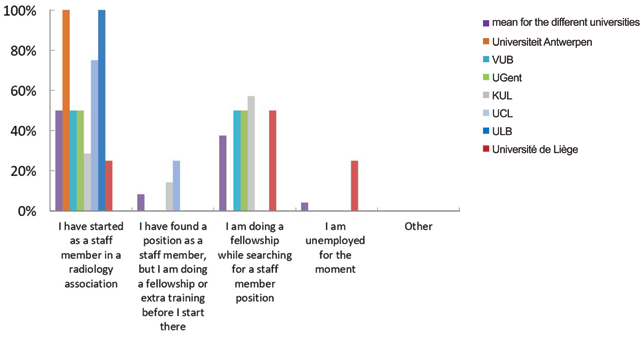
Figure 2
‘What kind of job will you start or have you started since your graduation?’ Results from the survey sent to the graduates of 2018, distributed per university.
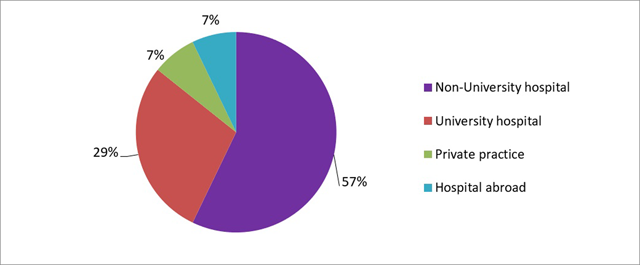
Figure 3
‘If you have found a job as a staff member, where is this?’ Results from the survey sent to the graduates of 2018.
Table 3
Results of the survey of the radiologists graduated in 2013 to 2017. UA: Universiteit Antwerpen. VUB: Vrije Universiteit Brussel, UGent: Universiteit Gent, KUL: Katholieke Universiteit Leuven, UCL: Université Catholique Louvain, ULC: Université Libre Bruxelles, ULiège, Université de Liège.
| UA | VUB | UGENT | KUL | UCL | ULB | ULIÈGE | |
|---|---|---|---|---|---|---|---|
| At which university did you graduate as a radiologist? | 7.9% | 11.2% | 11.2% | 42.7% | 10.1% | 14.6% | 2.3% |
| 2013 | 2014 | 2015 | 2016 | 2017 | |||
| In what year did you graduate as a radiologist? | 9.0% | 23.6% | 16.9% | 24.7% | 25.8% | ||
| No | Yes, in a Belgian university hospital | Yes, in a non-university hospital | Yes, a fellowship abroad | Other | |||
| Did you do an extra fellowship after general radiology? | 41.8% | 17.4 % | 17.4% | 21.4% | 2.0% | ||
| To further specialize | Out of necessity | With prospect of a permanent position | Other | ||||
| What was the main reason to do this extra training? | 43.9% | 29.8% | 10.5% | 15.8% | |||
| Before my graduation | <6 months after graduation | Between 6 months and 1 year | 1–2 years | 2–3 years | >3 years | Not yet | |
| How long after your graduation did you find a ‘permanent’ position? | 57.3% | 5.6% | 10.1% | 9.0% | 6.7% | 1.1% | 10.1% |
| Yes | No | I had no preference | |||||
| If your have found a permanent position, is this in the region you initially intended to work? | 59.8% | 24.4% | 15.9% | ||||
| University Hospital | Non-University hospital | Private practice | Hospital abroad | Other | |||
| If you are currently working as a staff member, this is in a: | 36.1% | 56.6% | 2.4% | 2.4% | 2.4% | ||
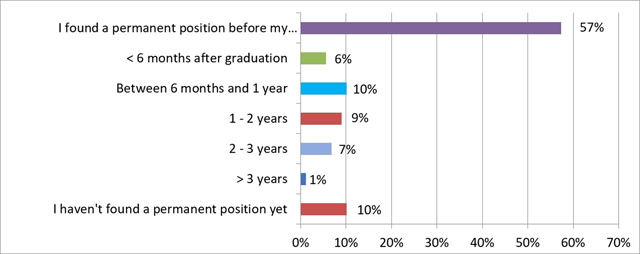
Figure 4
‘How long after your graduation did you find a ‘permanent’ position?’ Results from the survey sent to the graduates of 2013–2017.
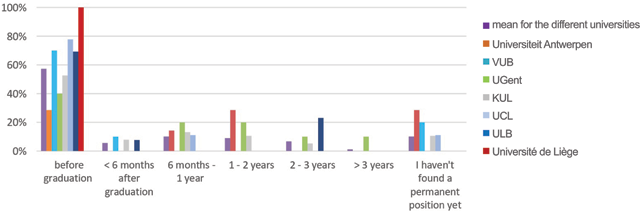
Figure 5
‘How long after your graduation did you find a ‘permanent’ position?’ Results from the survey sent to the graduates of 2013–2017, distributed per university.
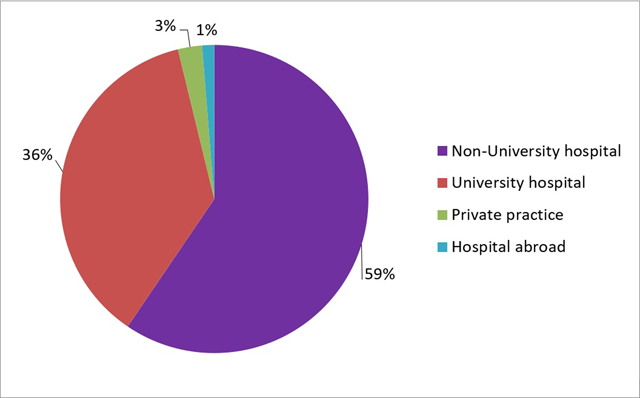
Figure 6
‘If you are currently working as a staff member, where is this?’ Results from the survey sent to the graduates of 2013–2017.
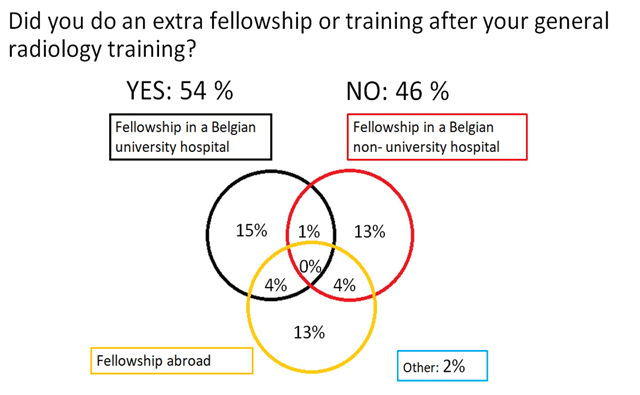
Figure 7
‘If you have done or are doing a fellowship, where is this?’ Results from the survey sent to the graduates of 2013–2017.

Figure 8
‘What was the main reason to do this extra training?’ Results from the survey sent to the graduates of 2013–2017.
Table 4
Results of the survey of the heads of departments of the university hospitals.
| None | 1–3 | 4–6 | 7–9 | >9 | |
|---|---|---|---|---|---|
| How many vacancies for staff members were filled in your association in since january 2013? | 0% | 0% | 40% | 40% | 20% |
| Yes | No | ||||
| Are you currently searching for a new staff member? | 60% | 40% | |||
| Choice 1 | Choice 2 | Choice 3 | |||
| Which profile would fit best in your association? | Musculo-skeletal imaging | Cardiac imaging | Head and neck imaging | ||
| None | 1–3 | 4–6 | 7–9 | More than 9 | |
| How many staff members do you plan to hire in the next five and a half years (until december 2023)? | 0 | 20% | 60% | 20% | 0% |
Table 5
Results of the survey of the heads of departments of the non-university hospitals.
| Flanders | Brussels | Wallonia | ||||
|---|---|---|---|---|---|---|
| Where is your hospital located? | 69.3% | 5.1% | 25.6% | |||
| 1–4 | 5–8 | 9–12 | 13–16 | 17–20 | >20 | |
| How many full time equivalent staff members does your association count? | 5.1% | 51.3% | 15.4% | 20.5% | 0% | 7.7% |
| None | 1 | 2 | 3 | 4 | >4 | |
| How many vacancies for staff members were filled in since january 2013? | 0% | 30.8% | 28.2% | 15.3% | 23.1% | 2.6% |
| General radiologist after training at one of the Belgian universities | Radiologist with an extra training in Belgium or abroad | A radiologist with some (>3) years of experience | Inter-national expert in radiology | A radiologist with extra competences in hospital management. | Other | |
| Which profile would fit best in your association? | 29.6% | 43.8% | 7.8% | 9.4% | 7.8% | 1.6% |
| Choice 1 | Choice 2 | Choice 3 | ||||
| If you would employ a new radiologist, which subpecialty would you prefer? (multiple anwers) | Musculoskeletal imaging (17.0% of responders) | Vascular and interventinal radiology (14.0% of responders) | Breast imaging (12.0% of responders) | |||
| None | 1 | 2 | 3 | >3 | ||
| How many graduated temporary work forces were employed in your association in 2017? | 74.4% | 10.3% | 5.1% | 5.1% | 5.1% | |
| Yes | No | |||||
| Are there currently radiologists-in-training in your association? | 51.3% | 48.7% | ||||
| None | 1 | 2 | 3 | >3 | ||
| How many staff member vacancies do you estimate to become available until december 2023 | 12.1% | 30.3% | 36.4% | 18.2% | 3.0% | |
| Expected cooperations between hospitals | Expected reforms in the financing of the health care system. | The availability of temporary work forces | Retirement of an actual staff member. | Other | ||
| Which of the following elements influence your decision to hire a new staff member? | 24.7% | 23.3% | 7.8% | 40.3% | 3.9% |
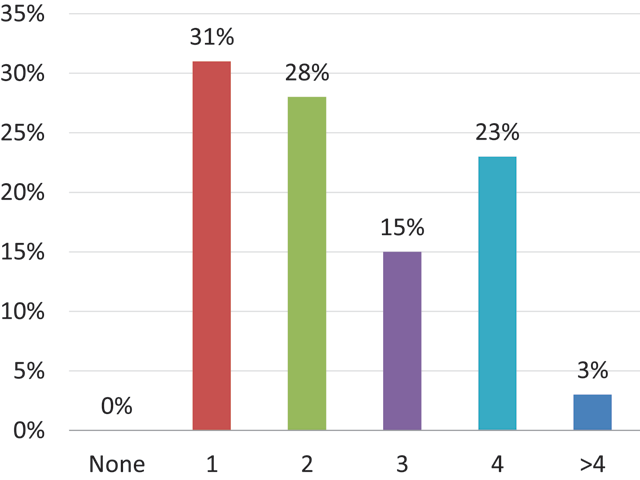
Figure 9
‘How many staff member vacancies were filled in since January 2013?’ Results from the survey sent to the heads of the non-university radiology departments.
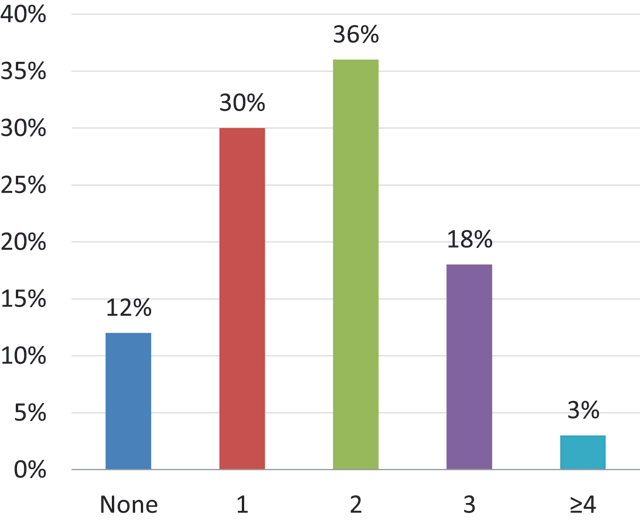
Figure 10
‘How many staff member vacancies do you estimate to become available from now until December 2013?’ Results from the survey sent to the heads of the non-university radiology departments.
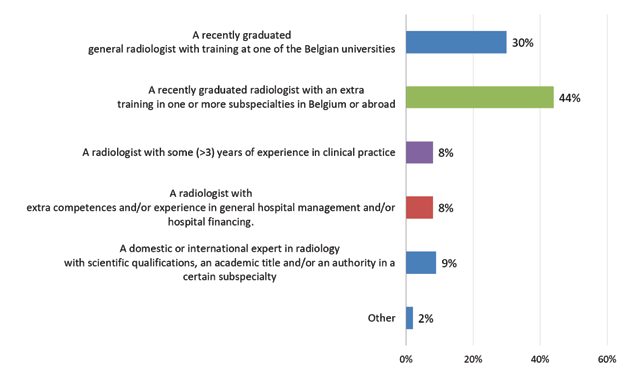
Figure 11
‘If you would employ a new radiologist, which subspecialty would you prefer?’ Results from the survey sent to the heads of the non-university radiology departments.
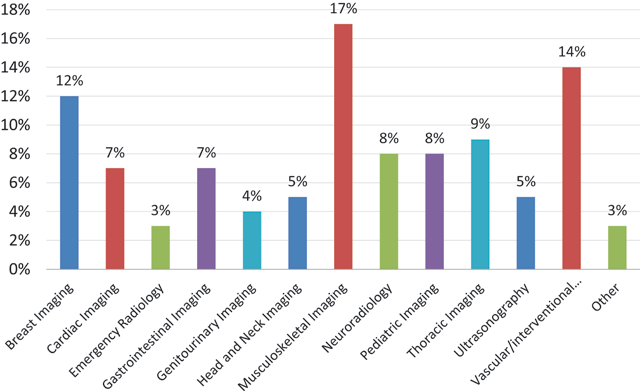
Figure 12
‘If you would employ a new radiologist, which subspecialty would you prefer?’ Results from the survey sent to the heads of the non-university radiology departments.
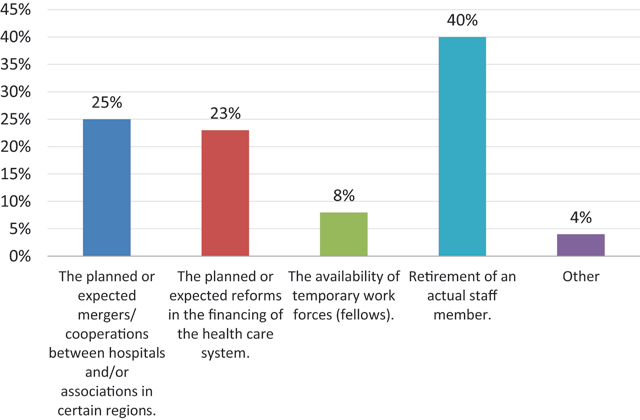
Figure 13
‘Which of the following elements influence your decision to hire a new staff member?’ Results from the survey sent to the heads of the non-university radiology departments.