
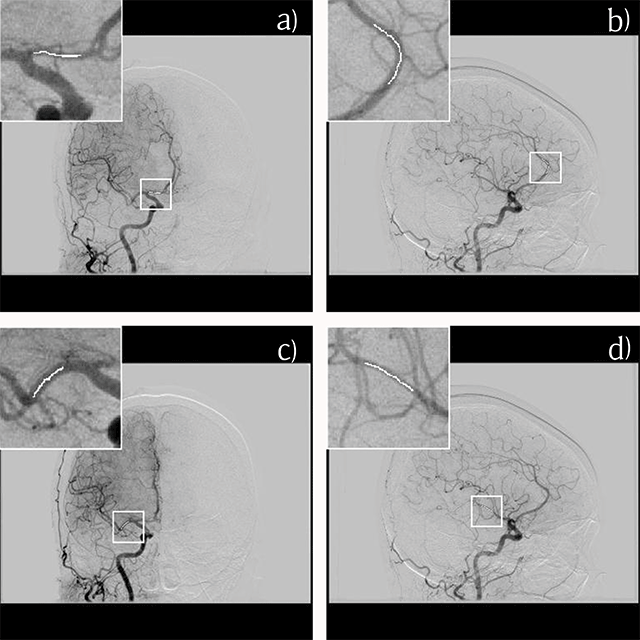
Figure 1
Measurement of contrast enhancement for the A1 (a), A2 (b), M1 (c) and M2 (d) segments on the source rotational two-dimensional digital subtraction angiography. The pixel value at the center of the projected vessel is extracted manually, and the average value on several images is calculated.
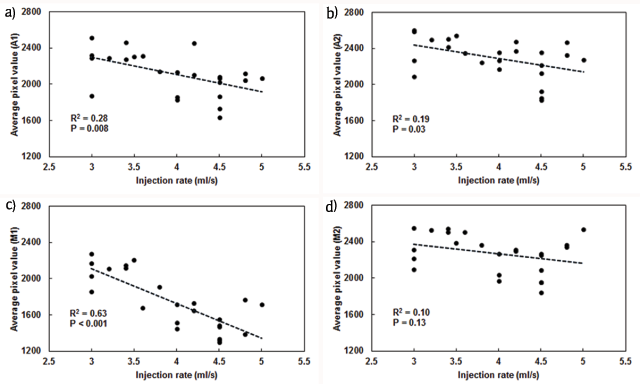
Figure 2
Relationship between injection rate and contrast enhancement for the A1 (a), A2 (b), M1 (c) and M2 (d) segments with straight lines fitted linear regression. Although the regression lines show that an increased injection rate lead to more contrast enhancement, there is no significant relationship for the M2 segment (d), which has the narrowest lumen size of the four segments.