
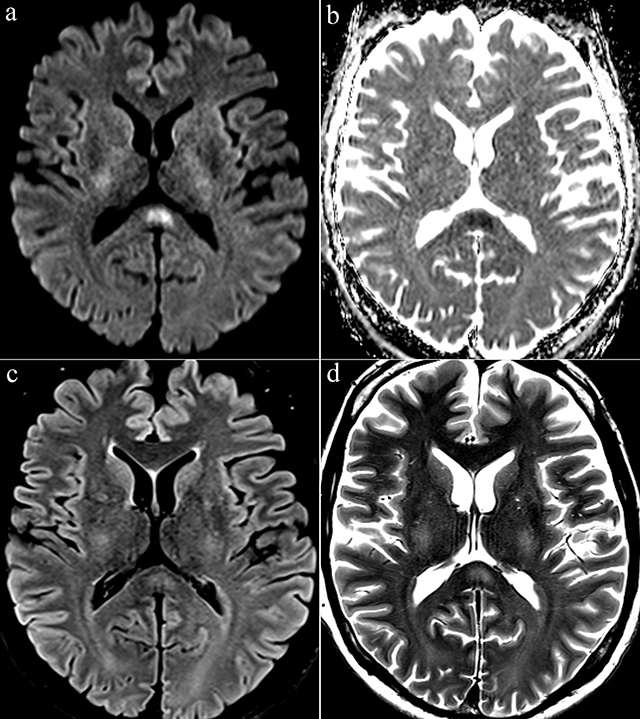
Figure 1
Axial diffusion-weighted image (b = 1000 s/mm2) (a) showed a high signal intensity in the splenium of corpus callosum. Apparent diffusion coefficent (ADC) map image (b) showed a low ADC. Axial FLAIR (c) and T2-weighted images (d) showed a slight hyperintense signal at the same location.