
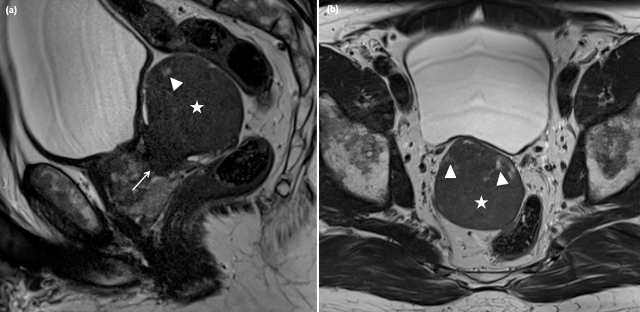
Figure 1
a) (sagittal T2w TSE) and b) (transverse T2w TSE). T2-weighted imaging showed a sharply demarcated structure (asterisk –5.8 × 6.5 × 5.2 cm) originating from the right part of the transition zone at the level of the midprostate (arrow) with massive posterior bulging The lesion was slightly T2 hyperintense relative to muscle (figure 1a and 1b), with small central T2 hyperintense areas (arrowhead).
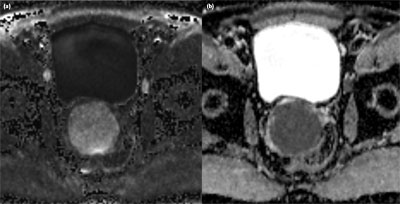
Figure 2
a) (b1400) and b) (ADC). The lesion has restricted diffusion on transverse high b-value image, corresponding to an ADC of 0.791 ×10⁻³ mm2/s.
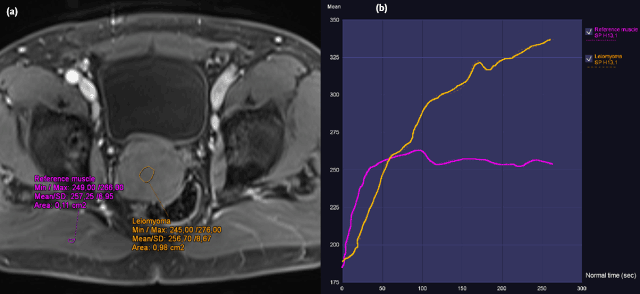
Figure 3
a) DCE (75 sec) and b) DCE curve. Transverse T1 vibe pre and post intravenous contrast showed homogeneous contrast uptake. The lesion showed slow first pass and progressive enhancement in second pass, the reference muscle (right sides musculus gluteus maximus) showed a slow first pass and a plateau in second pass.