
Table 1
Radiological classification of renal AML [9].
| UECT Region of interest (ROI) | MRI-CSI Tumour-to-spleen ratio (TSR) | MRI-CSI Signal intensity index (SII) | |
|---|---|---|---|
| Fat-rich AML | ≤ –10 HU | < 0.71 | > 16.5% |
| Fat-poor AML | > –10 HU | < 0.71 | > 16.5% |
| Fat-invisible AML | > –10 HU | ≥ 0.71 | ≤ 16.5% |
Table 2
| US | UECT | MRI-T1 | MRI-T2 | MRI-CSI | |
|---|---|---|---|---|---|
| Fat-rich AML | Markedly hyperechoic | Hypoattenuating | Signal loss on FS | Hyperintense | Decrease in signal intensity |
| Fat-poor AML | Slightly hyperechoic | Heterogeneously isoattenuating or hyperattenuating | +/– signal loss on FS | Heterogeneously or homogeneosly hypointense | Decrease in signal intensity |
| Fat- invisible AML | Isoechoic | Homogeneously hyperattenuating | No signal loss on FS | Homogeneously hypointense | No decrease in signal intensity |
[i] Note: FS = fat suppression; +/– = loss of signal on fat-suppressed MRI may or may not be present.
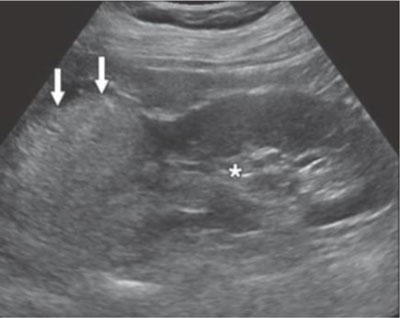
Figure 1
US image showing a fat-rich AML (arrow). The tumour is more hyperechoic than the right renal sinus (asterisk) [10].
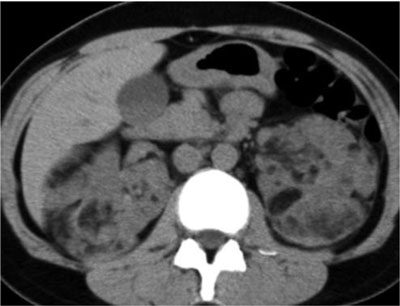
Figure 2
UECT showing bilateral and multiple AMLs in a patient with TSC. Each lesion contains attenuation numbers less than –10 HU, consistent with fat-rich AML [3].
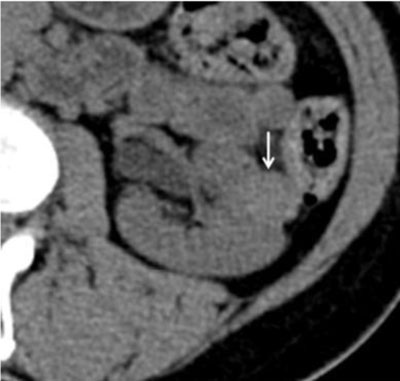
Figure 3
UECT demonstrating a left solid renal lesion (arrow). It appears homogeneously hyperdense and has attenuation values as high as 44 HU, consistent with fat-invisible AML [9].
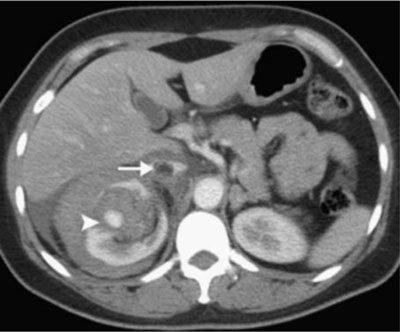
Figure 4
Contrast-enhanced CT showing two features: a perirenal hematoma and enhancing lesion with aneurysm formation (arrowhead) and a thrombus in the IVC (arrow) [15].
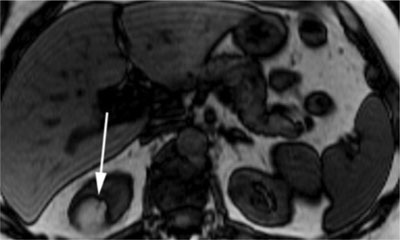
Figure 5
Opposed-phase T1-weighted MR image with a hyperintense renal mass. The India ink artefact (arrow) is present at the interface of the lesion with the kidney [16].