
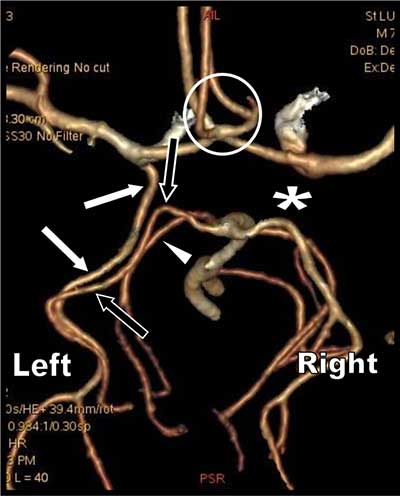
Figure 1
3D volume rendering view of the Circle of Willis obtained from the CT arterial phase. View from the vertex (left side is thus on the right of the figure).
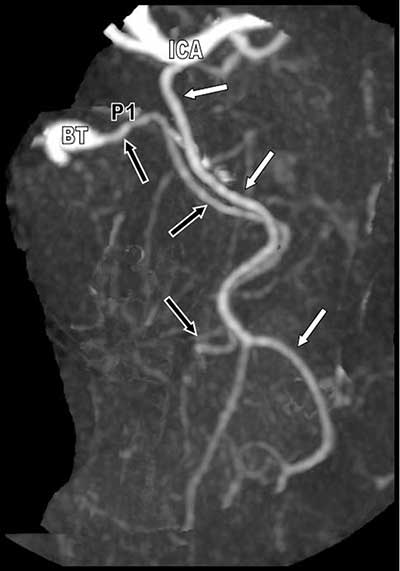
Figure 2
Selective oblique Maximal Intensity Projection (MIP) reformation of the duplicated left posterior cerebral arteries.
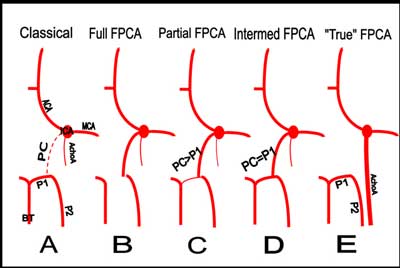
Figure 3
Schematic view of the different variants of PCA. PC = PcoA.