
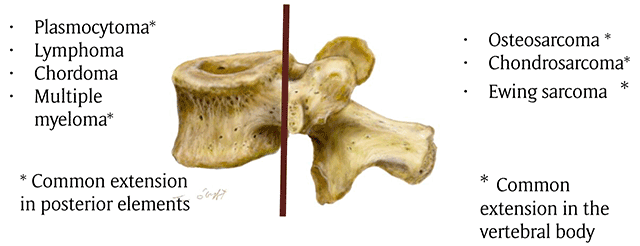
Figure 1
Drawing showing the common distribution of primary malignant tumors of spine. The brown line indicates the border between the vertebral body and posterior elements.
Table 1
Epidemiology of malignant primary tumors of the spine.
| Mean Age | Gender | % spinal involvement | Preferential location in spine | Preferential location in vertebrae | Involvement of adjacent vertebral level | |
|---|---|---|---|---|---|---|
| Osteosarcoma | 38 years | M>F | 4% of all osteosarcoma | Thoracic and lumbar levels >sacrum and cervical | Posterior elements (79%), partial vertebral body extension | 17% of cases Disk space is usually preserved |
| Chondrosarcoma | 45 years | M>F | <12% of all chondrosarcoma | Thoracic>cervical> lumbar | Posterior elements 40%, Vertebral body, both 45% | 35% of cases Disk space is usually preserved |
| Ewing sarcoma | 19.3 years | M>F | 3–10% | Sacro-coccygeal region>lumbar >thoracic>cervical spine | Posterior elements 60% | 8% of cases Disk space is usually preserved |
| Chordoma | 50–60 years | M>F | Spheno occipital skull base: 35% Sacro-coccygeal area: 50% Vertebral body: 15% Cervical spine>thoracic>lumbar | Vertebral body with sparing to the posterior elements | Soft tissue extension “mushroom appearance” spanning several segments and sparing the disks | |
| Plasmocytoma | >60% years | F>M | 25–50% | Thoracic vertebra | Vertebral body++ Extension in pedicles is frequent | May extend through the intervertebral disk |
| Lymphoma | 40–60 years | M>F | 1%–3% of all lymphomas 7% of primary bone tumors | – | Vertebral body++ Posterior involvement rare | Contiguous vertebral involvement is possible Disk space is usually preserved |
| Multiple myeloma | Rare under 30 years | M>F | Skeletal involvement in 80–90% of cases Vertebral involvement in 65% of cases | – | Vertebral body++ Extension in pedicles is frequent | May extend through the intervertebral disk |
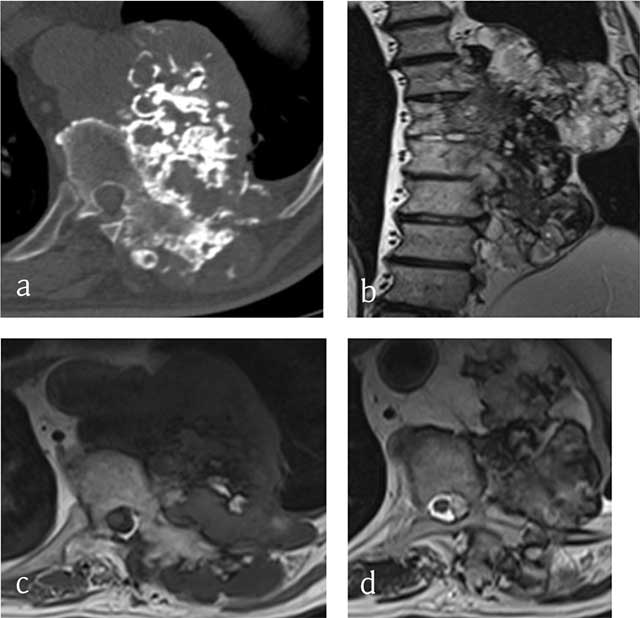
Figure 2
Chondrosarcoma of T8, T9 and T10. (a) Axial CT scan shows a large mass arising from the vertebral body with ring-and-arc calcifications. MRI (b) coronal T2-WI, (c) Axial T1-WI and (d) Axial T2-WI show a heterogenous mass consisting of lobules of intermediate signal intensity on T1-WI with residual intralesional bony trabeculae and high signal on T2-WI sourrounded by hypointense ring-and-arcs.
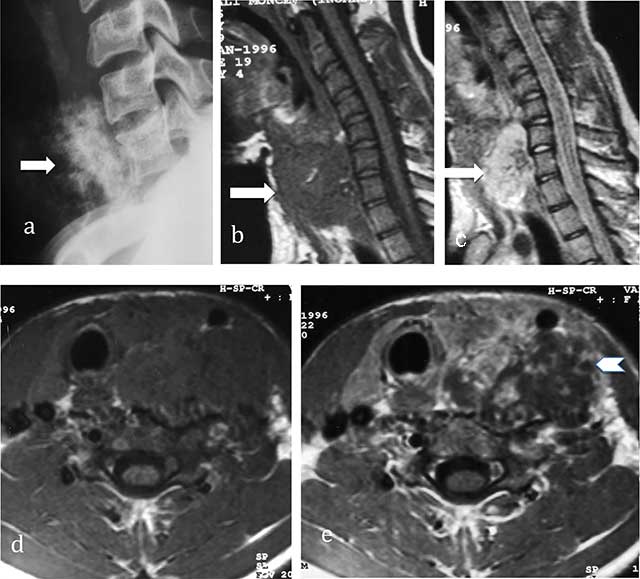
Figure 3
Chondrosarcoma of C7. (a) Lateral radiograph of cervical spine shows a large iuxta-osseous calcified mass arising from the vertebral body of C7 (arrow). (b, c, d, e) MR: Sagittal T1-WI, Sagittal T2-WI, Transversal T1-WI, Transversal T1-WI after gadolinium contrast injection show lobulated mass of intermediate signal intensity on T1-WI and high signal intensity on T2-WI (arrows) with ring-and-arc enhancement (arrowhead).
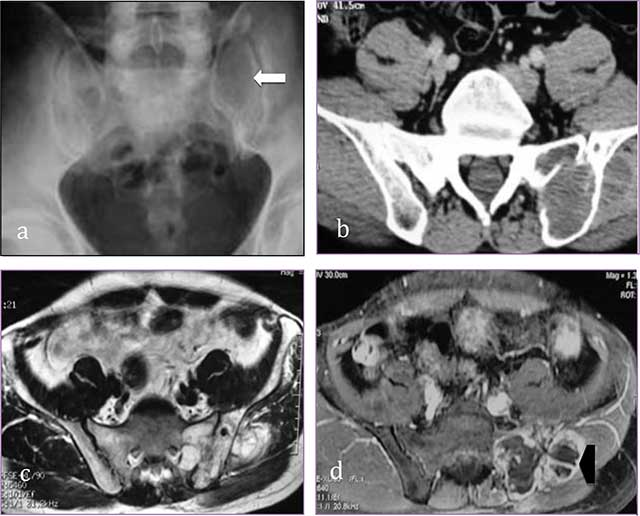
Figure 4
Sacral chondrosarcoma. (a) Plain radiograph of pelvis shows an ill-defined osteolytic lesion of left sacrum (white arrow). (b) transversal CT scan shows extension through the left sacroiliac joint, the ilium and the gluteal muscles. (c, d) MR: transversal T2-WI, transversal T1-WI after gadolinium contrast injection show a lobulated mass predominantly of high signal intensity on T2-WI with ring-and-arc enhancement (arrowhead).
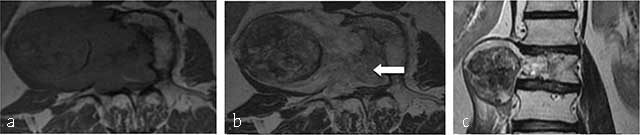
Figure 5
Chordoma of L2. MR. (a) Axial T1-weighted, (b) axial T1-WI after gadolinium contrast injection, coronal T2-WI (c) show a lobulated mass lesion of heterogeneous signal originating from the vertebral body of L2 with large soft tissue component extending into the paravertebral muscles (curved arrow) and anterior epidural space (arrow).
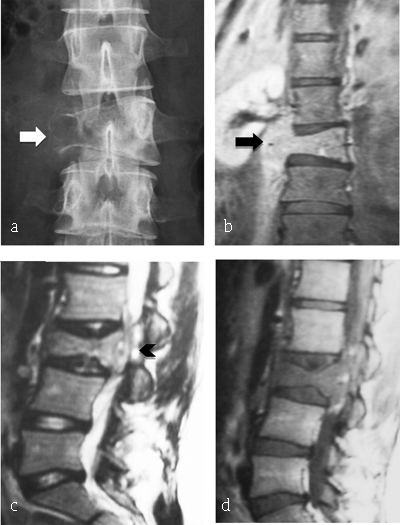
Figure 6
Ewing Sarcoma of L3. (a) Plain radiograph of lumbar spine reveals lytic lesion of right pedicle and right transverse process with partial vertebral collapse (arrow). (b, c, d) MR: coronal T2-WI, sagittal T2-WI and T1-WI after gadolinium reveal vertebral lesion of L3 with high signal intensity on T2-WI, enhancing after gadolinium injection and extending to prevertebral muscles (arrowhead) and to epidural space (arrow).
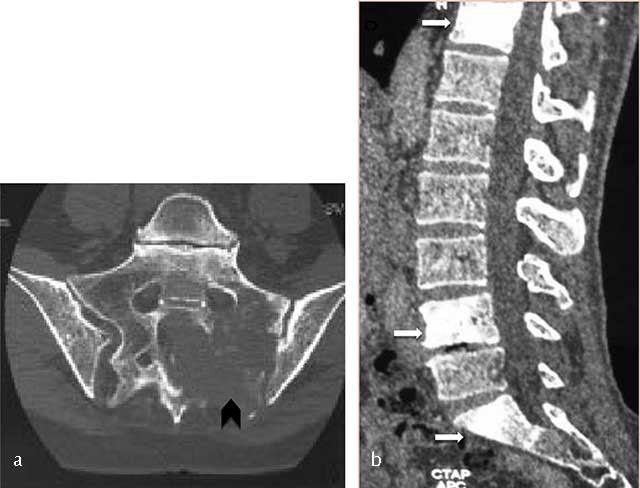
Figure 7
Lymphoma of the sacrum. Axial CT scan image shows a destructive lesion of sacrum extending through the left sacroiliac joint (arrowhead).
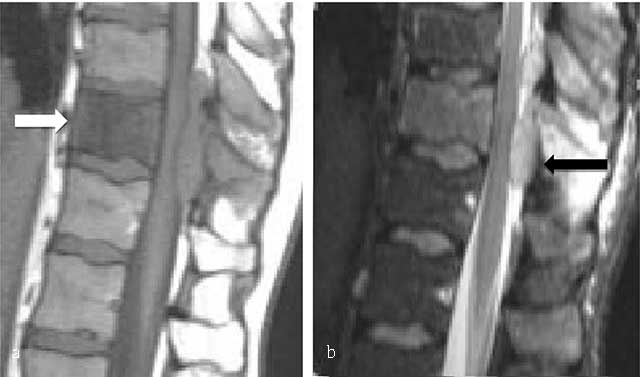
Figure 8
B-cell lymphoma of L2. MR: (a) Sagittal T1- and (b) T2-WI image show an osseous lesion of L2 (white arrow) extending into spinous process of L1 and L2 and in the posterior epidural spaces (black arrow) but without extension through the intervertebral disk.
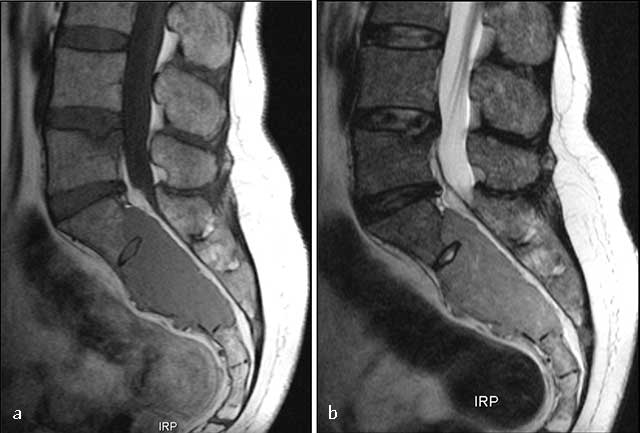
Figure 9
Sacral plasmocytoma. MR: (a) Sagittal T1-WI shows homogenous mass involving S1, S2 and S3 with intermediate signal intensity. (b) Sagittal T2-WI show a high signal intensity of the mass extending into the pelvis, epidural space, and posterior elements.
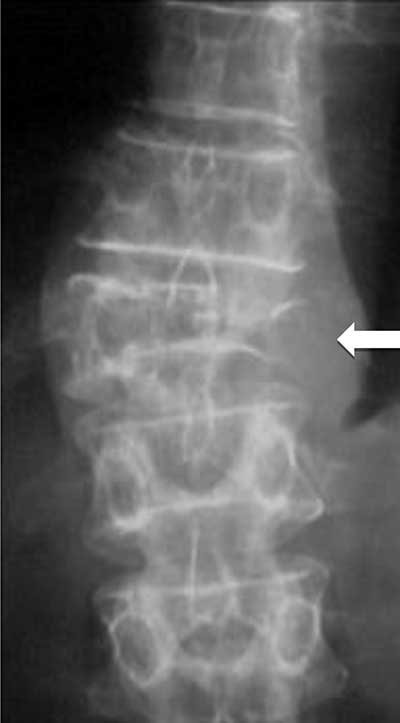
Figure 10
Multiple myeloma. Plain radiograph of spine shows an osteolytic lesion with cortical breakthrough, vertebral collapse and soft tissue mass (arrow).
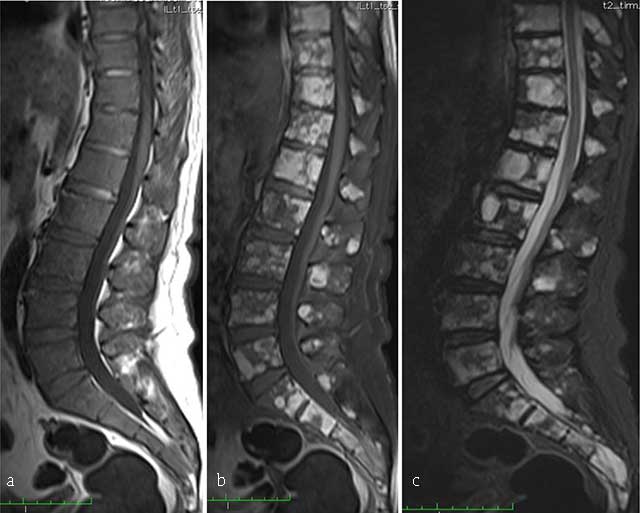
Figure 11
Multiple myeloma. MR: (a) Sagittal T1-WI, (b) sagittal fat-suppressed T1-WI after gadolinium contrast administration and (c) sagittal fat-suppressed T2-WI of the thoracolumbar spine display a diffuse bone marrow infiltration of vertebrae with low signal intensity on T1-WI and intermediate to high signal intensity on T2-WI. There is multifocal enhancement.