
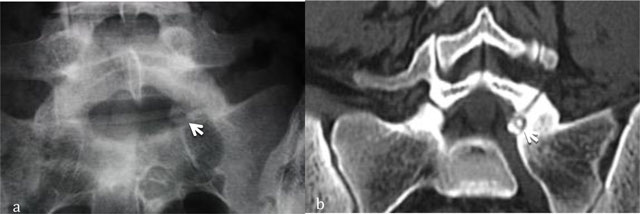
Figure 1
Osteoid osteoma of L5. Radiograph (a) shows focal lucency in the neural arch. CT scan (b) shows the calcified nidus (arrow).
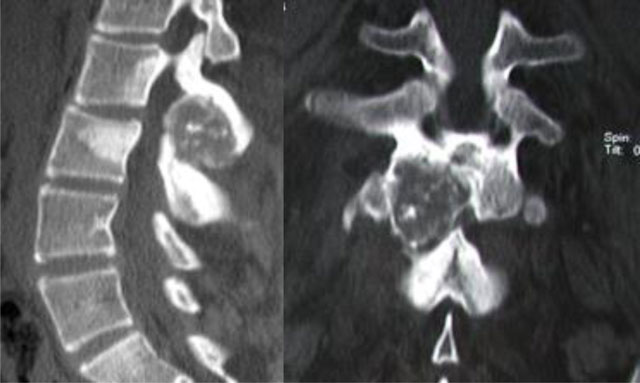
Figure 2
Osteoblastoma of L2. CT scan shows an expansive osteolytic lesion of the L2 neural arch with central calcification, sclerosis of the body and the neural arch of L2 and L3.
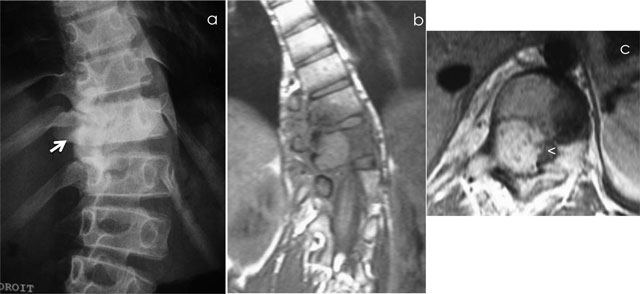
Figure 3
Osteoblastoma of T11. Radiograph (a) shows scoliosis and focal sclerosis of T11 (arrow). Coronal T1-WI (b) and axial T1-WI after gadolinium contrast administration (c) shows a lesion of the neural arch of T11, intralesional calcification and adjacent bone marrow edema of the vertebral bodies of T10 and T11. Note the compression of spinal cord (arrowhead).
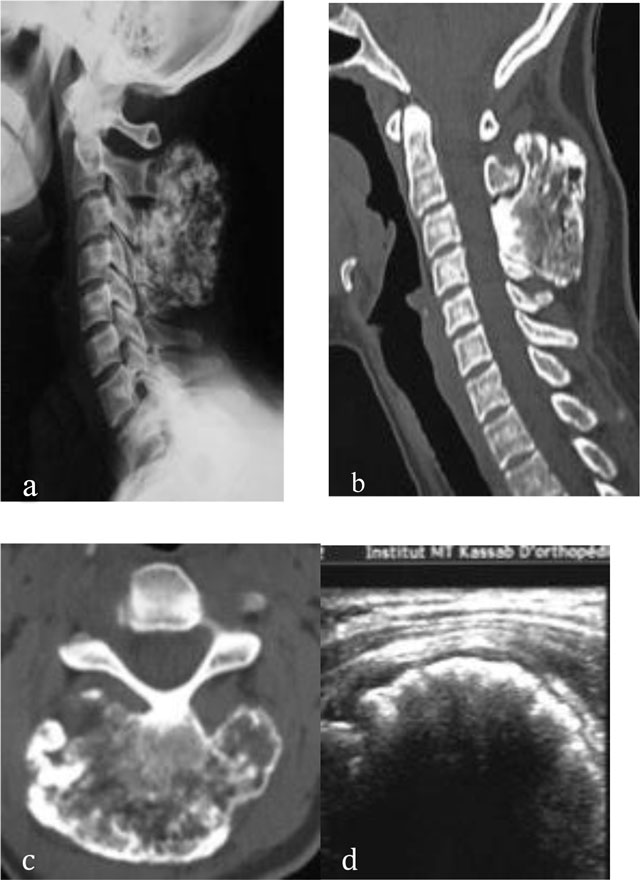
Figure 4
Osteochondroma of the cervical spine. Radiograph (a) shows an osseous mass located in the spinous processes of C3 and C4. CT scan (b, c) shows continuity of the osteochondroma with the spinous processes of C3 and C4. US (d) demonstrates a thin cartilaginous cap.
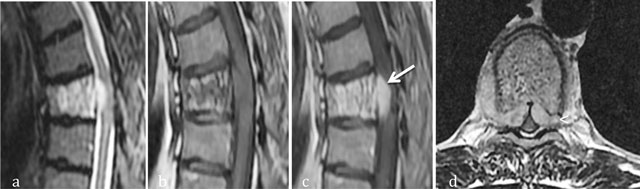
Figure 5
Aggressive hemangioma of T5. Sagittal T2-WI (a), Sagittal T1 WI (b) and sagittal (c) and axial (d) T1-WI after gadolinium contrast administration (c) MR images shows an aggressive hemangioma of T6 with extension into the anterior epidural space (arrow) and soft tissues (arrowhead).
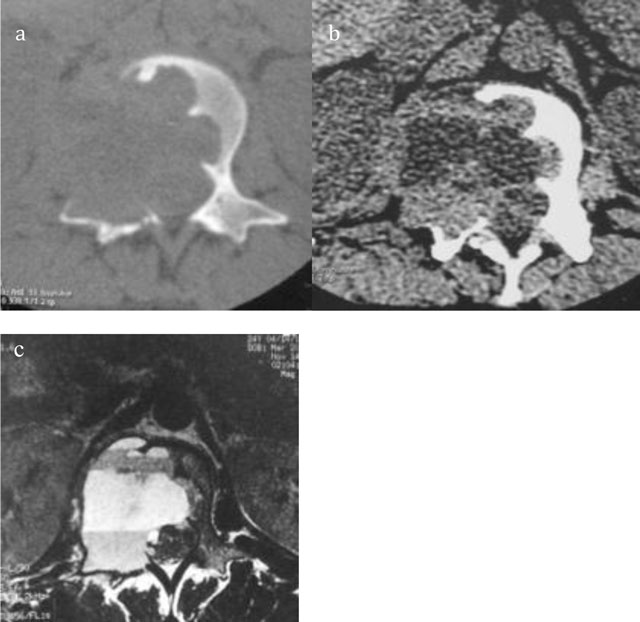
Figure 6
Giant Cell Tumor of L2. Axial CT scan of L2 shows a multiloculated lytic lesion (a) with intralesional fluid–fluid levels (b). Axial T2-WI MRI confirms an expansile multiloculated lesion of the body and neural arch containing fluid-fluid levels (c).
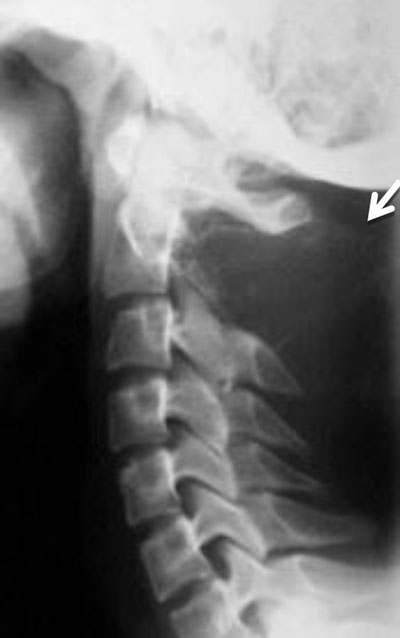
Figure 7
Aneurysmal bone cyst of C2. Lateral radiograph of the cervical spine shows an expansile lesion of the spinous process of C2 (arrow).
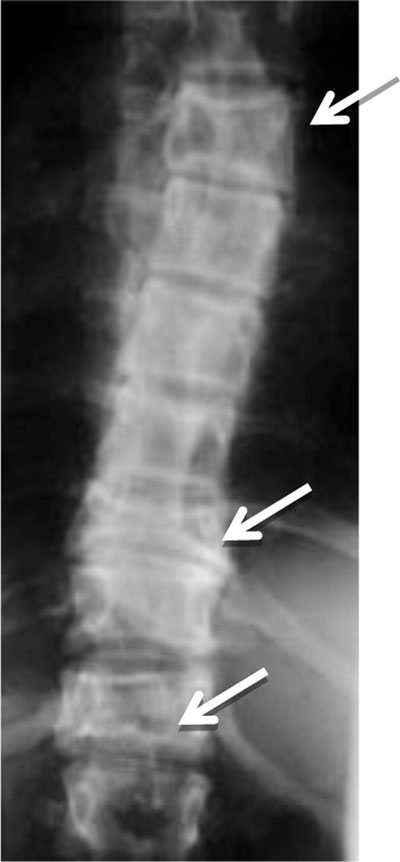
Figure 8
Polyostotic Fibrous Dysplasia. Radiograph shows collapse of multiple vertebral bodies (T6, T10, T12) with a ground glass matrix.
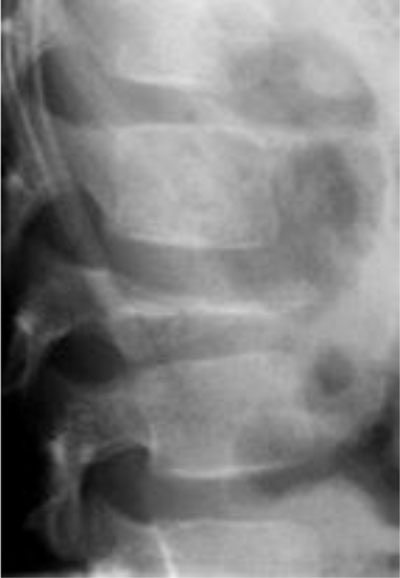
Figure 9
Eosinophilic granuloma (solitary form of Langerhans’ cell histiocytosis). Lateral radiograph shows collapse of the vertebral body L1 (vertebra plana).
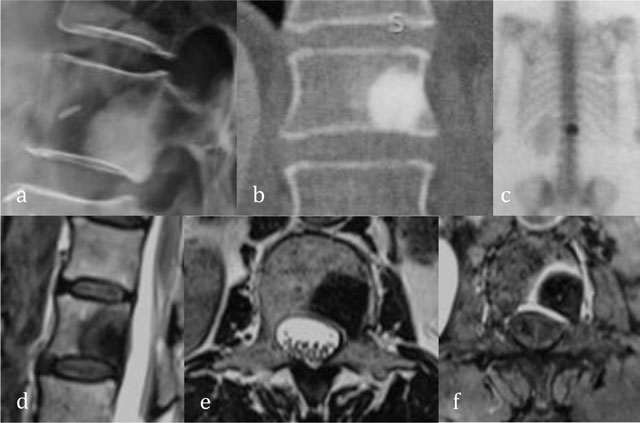
Figure 10
Enostosis of L1. Radiograph (a) and coronal reformatted CT (b) show a focal area of dense bone similar to cortical bone. Bone scintigraphy (c) show an avid uptake. Sagittal T2-WI (d), axial T2-WI (e) and axial T1-WI after administration of gadolinium contrast (f) show central low signal intensity surrounded by intermediate T2 signal and peripheral enhancement.