
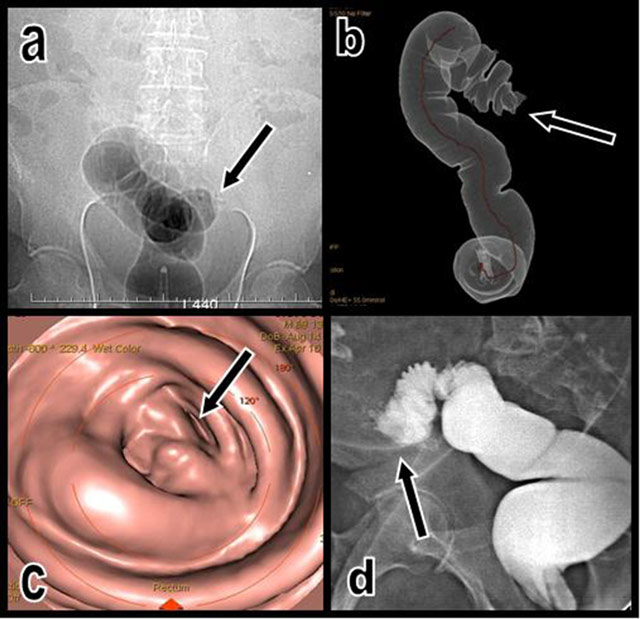
Figure 1
The topogram performed just after unsuccessful CO2 insufflation of the colon (a) illustrates an impassable colonic stenosis at the level of the junction between the sigmoid and descending colon (black arrow). A corresponding volume-rendering view (b) of the insufflated segment shows the abrupt cutoff (black arrow). Corresponding virtual endoscopic view of the cutoff (c). A classical colonic retrograde opacification obtained the next day after CT (d) also confirms the nearly complete cutoff of the colon proximal sigmoid; only a small amount of hydrosoluble contrast can pass through the stenosis (black arrow).
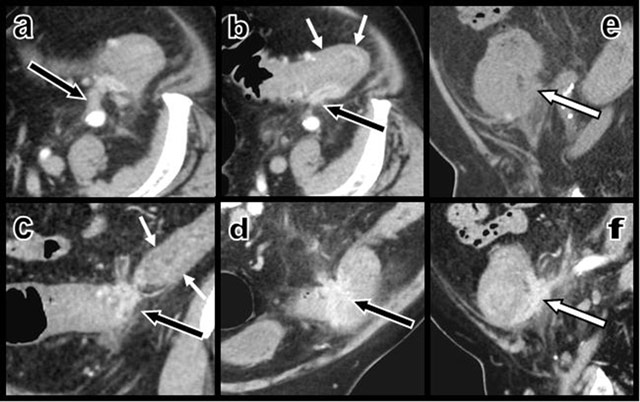
Figure 2
Contrast-enhanced axial CT views (a and b) and coronal oblique (c and d) multiplanar reconstructions (MPR) show a contrast-enhancing “scar-like” structure (black arrows) infiltrating the thickened colonic wall – due to a hypertrophy of the muscular layers (small white arrows) as confirmed by ultrasound – at the level of the sigmoid and descending colonic junction. This retracting tissue develops multiple adherences with the retroperitoneum. Sagital MPR views before (e) and after (f) intravenous iodine contrast injections illustrate the sharp enhancement of the curvilinear retractile “scar” (white arrow) that infiltrates the colonic wall and staples the colon on the retroperitoneum.
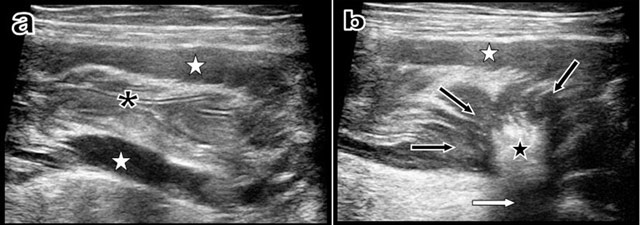
Figure 3
Longitudinal ultrasound view (a) of the descending colon just proximally to the stenosis shows that the colonic lumen is absolutely empty with normal mucosal folds (black asterisk). Nevertheless, hypertrophy of the muscular layers is evident (white stars). Another longitudinal ultrasound view (b) obtained just at the level of the retractile “scar-like” process shows the retractile centripedic convergence of the muscular layers (black arrows) towards a sharply well-delimitated hyperechoic (black star) and hyper-attenuating intraparietal scar (white arrow).
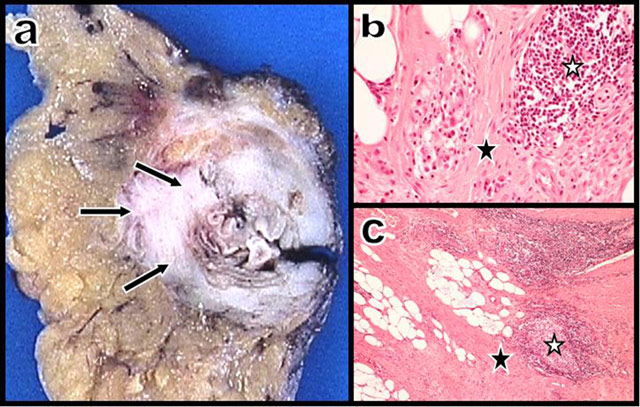
Figure 4
Gross anatomy (a) of the colonic wall shows a corbelling fibrosis infiltrating the wall of a diverticular segment. Photomicrographs – hematoxylin and eosin, × 20 (b) and × 5 (c) – show typical fibrosis (black star) with discrete chronic inflammatory infiltrates and lymphoid clusters (white stars).