
Table 1
Conventional radiography of the shoulder [1].
| Projections | Main visualized anatomy and pathology |
|---|---|
| Anteroposterior – neutral arm position | Anterior dislocation Fracture of proximal humerus, clavicle, and scapula (i.e. Bankart lesion) Fat-fluid level (erect position) |
| Anteroposterior – internal arm rotation | Hill-Sachs lesion (posterolateral humeral head impacted fracture) |
| Anteroposterior – external arm rotation | Trough sign (anteromedial humeral head compression fracture) in posterior dislocation |
| Scapula ‘Y’ (true lateral view of scapula or outlet view) | Fracture of scapular body, acromion, coracoid process, proximal humerus Humeral head to glenoid fossa relationship |
| Axillary (superoinferior view) | Humeral head to glenoid relationship |
| Lawrence (no full abduction required) | Anterior and posterior dislocation |
| West Point (minimal arm abduction) | Anteroinferior rim of glenoid (West Point view) |
| Outlet (oblique) | Acromial fracture and morphology Rotator cuff outlet |
| Grashey (posterior oblique with glenoid in profile) | Glenohumeral joint space (obliterated in posterior dislocation) |
| Acromioclavicular (without/with stress) | Acromioclavicular joint separation |
| Bicipital groove (tangent, humeral head) | Bicipital groove |
| Lateral transthoracic (true lateral view of proximal humerus) | Proximal humeral fracture Humeral head to glenoid relationship |
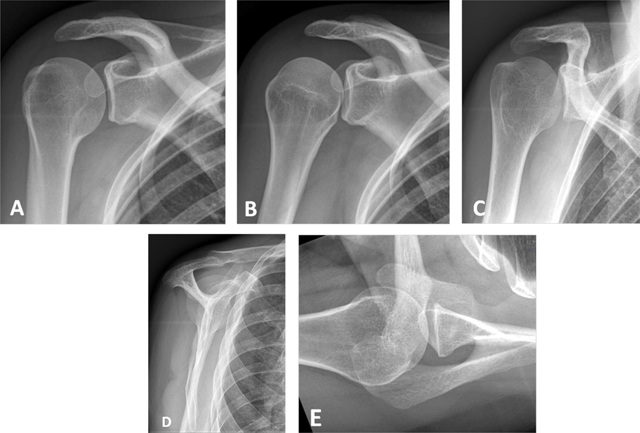
Figure 1
Conventional radiographs of the shoulder. (A) Anteroposterior (AP) view with external rotation; (B) AP with internal rotation; (C) AP with neutral arm position; (D) Lateral view of scapula or ‘Y’ view; (E) Axillary view.

Figure 2
Normal red bone marrow in a young adult. (A) Sagittal oblique T1-weighted and (B) Coronal oblique fat-suppressed PD-weighted MR images detect areas of red marrow in the proximal humeral diaphysis with low signal intensity on T1 (arrow, A) and increased signal on fat-suppressed PD (arrow, B). This is usually observed bilaterally and without epiphyseal involvement. Cortical bone has a low signal intensity on both sequences (arrowhead, A and B).
Table 2
Example of standard MRI protocol of the shoulder (based on the guidelines of the European Society of Skeletal Radiology (ESSR) Sports Subcommittee 2016).
| FOV (max) | Slice (max) | TE | Matrix (min) | |
|---|---|---|---|---|
| Axial fat suppressed (FS) proton density (PD) | 16 cm | 3 mm | 10–40 | 256 × 256 |
| Coronal oblique FS PD | 16 cm | 3 mm | 10–40 | 256 × 256 |
| Sagittal oblique FS PD | 16 cm | 3 mm | 10–40 | 256 × 256 |
| Sagittal oblique T1 | 16 cm | 3 mm | Min | 256 × 256 |
| Coronal oblique T2 | 16 cm | 3 mm | 80–100 | 256 × 256 |
| Axial GRE 2D (or 3D) (optional) | 16 cm | 2 (or 1) mm | 3–10 | 256 × 256 |
Table 3
Example of standard MRA protocol of the shoulder (based on the guidelines of the European Society of Skeletal Radiology (ESSR) Sports Subcommittee 2016).
| FOV (max) | Slice (max) | TE | Matrix (min) | |
|---|---|---|---|---|
| Axial T1 | 16 cm | 3 mm | Min | 256 × 256 |
| Axial FS PD | 16 cm | 3 mm | 10–40 | 256 × 256 |
| Sagittal oblique FS PD | 16 cm | 3 mm | 10–40 | 256 × 256 |
| Coronal oblique FS T1 | 16 cm | 3 mm | Min | 256 × 256 |
| Coronal oblique FS PD | 16 cm | 3 mm | 10–40 | 256 × 256 |
| ABER FS T1 (optional) | 16 cm | 3 mm | Min | 256 × 256 |
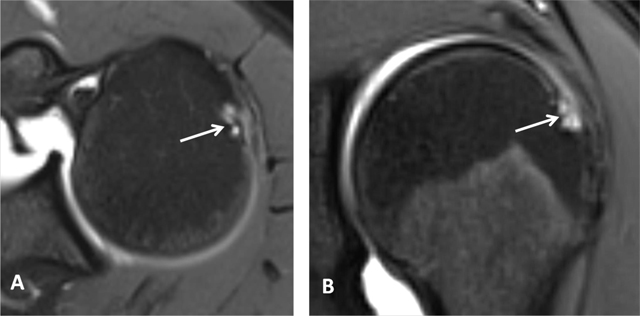
Figure 3
Subchondral cysts of the humeral head and normal bare area. (A) Axial and (B) Coronal oblique fat-suppressed T1-weighted MR arthrographic images show subchondral cysts at the attachment of the infraspinatus tendon (arrow). Coronal oblique section of the same patient discloses a normal bare area in the posterolateral aspect of the humeral head with small fibrocystic changes that communicate with the joint and should not be mistaken for a cartilage defect (arrow, B). Such changes are common and often asymptomatic.
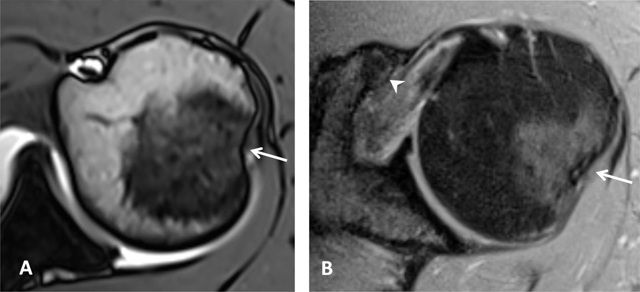
Figure 4
Normal humeral head versus Hill-Sachs lesion. (A) On the axial T2 gradient echo weighted MR image, there is a slight flattening of the posteroinferior surface of the humeral head (arrow), which is a normal finding. (B) Axial fat saturated T2-weighted MR image obtained at the level of the coracoid process (arrowhead, B) typically shows a Hill-Sachs defect (arrow) in a patient with history of anterior shoulder dislocation.
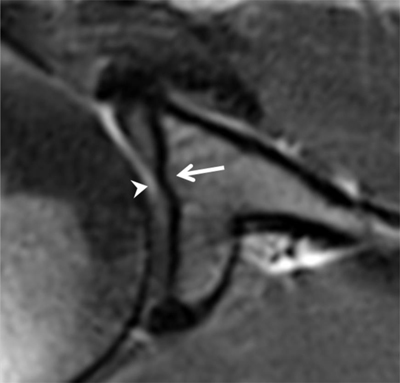
Figure 5
Tubercle of Assaki. Axial fat-saturated PD-weighted MR image shows focal elevation of the subchondral bone (arrow) in the mid third of the glenoid with focal thinning of overlying cartilage (arrowhead).
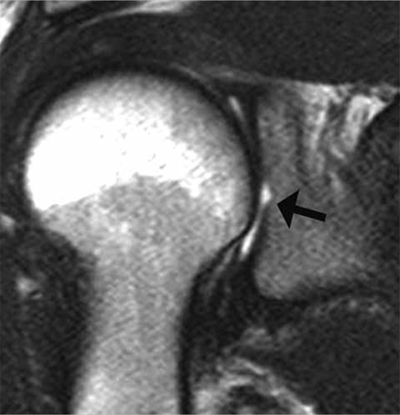
Figure 6
Bare area of the glenoid on MRI. Coronal oblique PD-weighted MR image displays a defect in the cartilage filling up with a moderate amount of joint fluid (arrow) without any thickening of the subchondral bone. As for the tubercle of Assaki, the bare area of the glenoid may be mistaken for a cartilage ulceration.
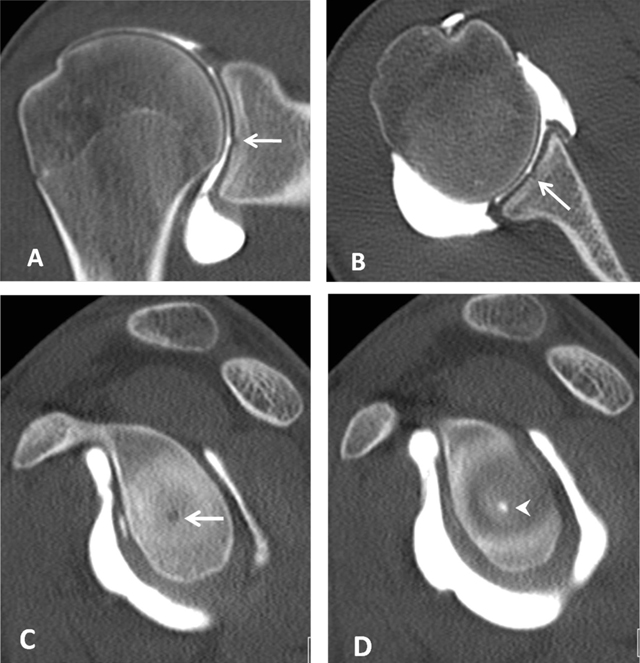
Figure 7
Bare area of the glenoid on CTA. (A) Coronal, (B) Axial and (C, D) Sagittal reconstructed CTA images demonstrate in the mid third of the glenoid a defect of the hyaline cartilage located centrally (arrows, A–C). On D, the defect is filled up by the injected contrast (arrowhead).
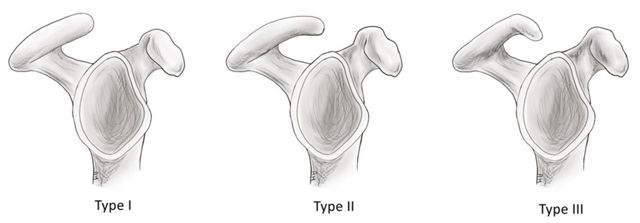
Figure 8
Schematic illustration of the acromion shape as described by Bigliani. Type I: flat; Type II: curved; Type III: hooked.
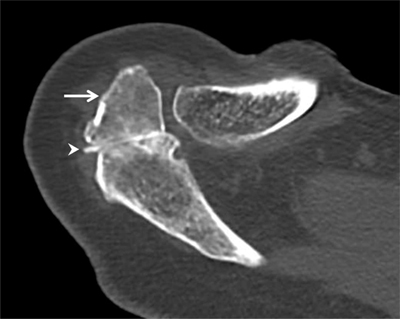
Figure 9
Os acromiale. Axial CT arthrography through the acromioclavicular joint demonstrates an os acromiale (arrow) with synchondrosis (arrowhead). An os acromiale should not be confused with a fracture fragment and the synchondrosis with a pseudarthrosis. In this case, there is a communication between the synchondrosis and the glenohumeral joint (with high-density contrast penetration), which is not normal. Subchondral cystic changes are also seen in the zone of pseudarthrosis.
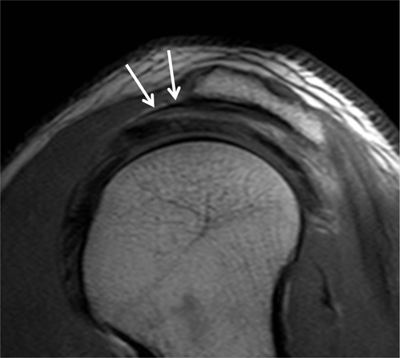
Figure 10
Subacromial pseudospur. Sagittal oblique PD-weighted MR image demonstrates the normal coracoacromial ligament at its acromial attachment that may mimic an osteophyte (arrows).
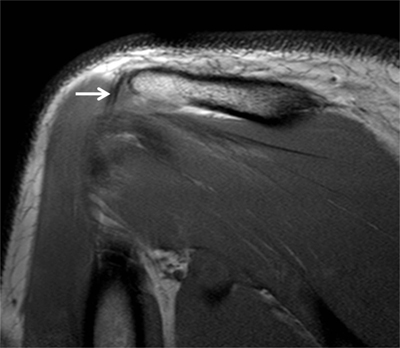
Figure 11
Subacromial pseudospur. Coronal oblique PD-weighted MR image depicts the normal attachment of the tendon of the deltoid muscle visible on one single section mimicking an enthesophyte (arrow). Analysis of consecutive coronal oblique MR images is necessary to avoid misinterpretation.
Table 4
Normal anatomic structures that may mimic pathology.
| Normal variants/Pitfalls | Mimicked Pathologies |
|---|---|
| Bone marrow reconversion | Pathological bone marrow replacement as in lymphoma or other tumors |
| Os acromiale | Fracture fragment of the distal acromion or normal acromioclavicular joint |
| Acromial insertion of the coracoacromial ligament | Acromial pseudospur |
| Acromial attachment of the deltoid tendon | Acromial pseudospur |
| Physiological posterolateral flattening of the humeral neck | Hill Sachs lesion |
| Physiological bare area in the posterolateral aspect of the humeral head | Humeral cartilage defect |
| Cystic changes of the humeral head | Reactive subchondral cysts of the lesser tuberosity and anterior aspect of the greater tuberosity related to rotator cuff tendinopathy and tears |
| Cartilage thinning at the tubercle of Assaki of the glenoid | Glenoid cartilage defect |
| Sublabral recess | Superior labral with anterior and posterior extension (SLAP) tear |
| Sublabral foramen | Anterior labral tear |
| Buford complex with an absent anterior superior labrum | Anterior superior labral tear or a displaced labral fragment due to middle glenohumeral ligament attachement directly on the anterosuperior glenoid |
| Supraspinatus-infraspinatus interdigitation | Tendinopathy |
| Rotator cable | Rotator cuff tear |
| Inferior glenohumeral ligament | Displaced labral fragment |
| Prominent synovial folds of the axillary recess | Loose bodies |
| Accessory head of the biceps muscle | Longitudinal split tear of the long head of the biceps tendon |
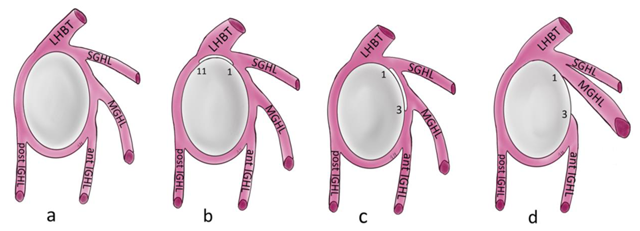
Figure 12
Schematic illustration of the normal capsulolabral complex and anatomical variations. They are shown on a lateral view onto the glenoid. (a) Normal anatomy; (b) Sublabral recess (sublabral sulcus); (c) Sublabral foramen (sublabral hole); (d) Buford complex. LHBT: long head of biceps tendon, SGHL: superior glenohumeral ligament, MGHL: middle glenohumeral ligament, IGHL: inferior glenohumeral ligament.
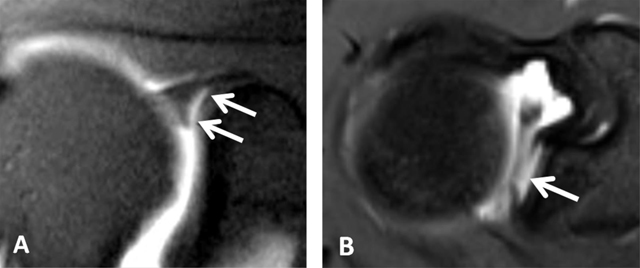
Figure 13
Sublabral recess (sublabral sulcus). (A) Coronal oblique fat-suppressed T1-weighted MR arthrographic image shows a sublabral recess as an increased linear signal undercutting the contour of the superior glenoid labrum (arrows, A) following the contour of the glenoid cartilage without extension posterior to the biceps anchor. This sulcus is visualized on (B) Axial T1-weighted MR arthrographic image (arrow, B) on an upper section.
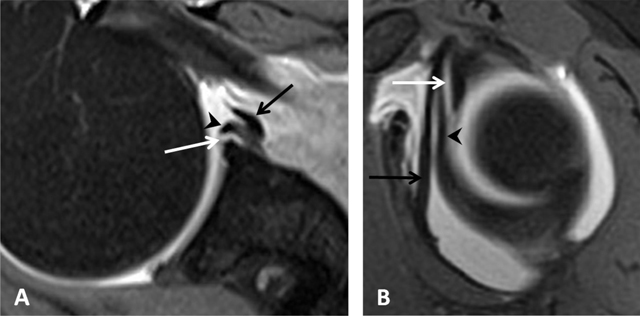
Figure 14
Sublabral foramen (sublabral hole). (A) Axial and (B) Sagittal fat suppressed T1-weighted MR arthrogram of a sublabral foramen. Sublabral foramen is located between the one o’clock and three o’clock position and provides a communication between the glenohumeral joint and the subscapularis recess (white arrows). Note the smoothly contoured, otherwise normal appearing anterior superior labrum (arrowheads), and middle glenohumeral ligament (black arrows) (Courtesy of Dr Deepu Alex Thomas).
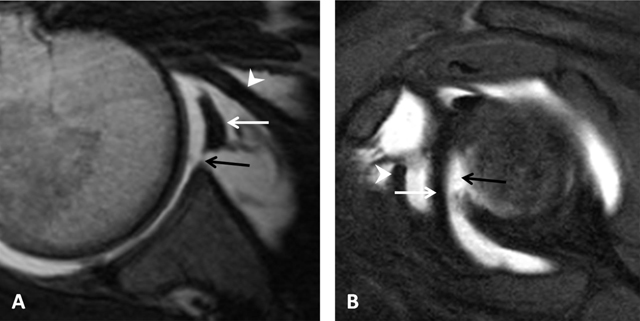
Figure 15
Buford complex. (A) Axial PD-weighted and (B) Sagittal fat-suppressed T1-weighted MR arthrographic images show a cord-like middle glenohumeral ligament (white arrow) associated with an absent anterior superior labrum (black arrow) mimicking a labral tear with normal posterior labrum. Subscapularis tendon (arrowhead). (Courtesy of Dr Henri Guerini).
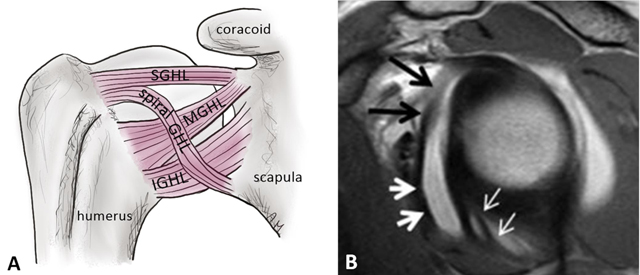
Figure 16
Glenohumeral ligaments and spiral glenohumeral ligament (fasciculus obliquus). (A) Schematic illustration of the anterior ligaments of the shoulder. SGHL: superior glenohumeral ligament, MGHL: middle glenohumeral ligament, IGHL: anterior band of the inferior glenohumeral ligament, spiral GHL: spiral glenohumeral ligament or fasciculus obliquus. (B) Sagittal oblique PD-weighted MR arthrogram image shows the fasciculus obliquus (thick white arrows, B), the frenula capsulae (synovial bands) (thin white arrows, B) and the middle glenohumeral ligament (black arrows, B) can be identified on this sagittal section.
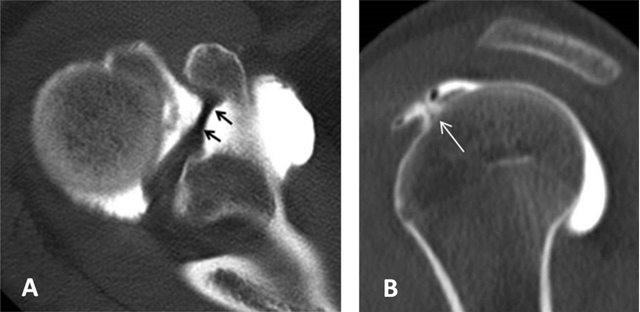
Figure 17
Superior glenohumeral ligament. It can be seen as a medium-size structure running almost straight from the superior labrum into the direction of the coracoid process on axial CTA (black arrows, (A). On sagittal CTA, the ligament appears as a T-shaped structure (thin white arrow, (B) Interposed between the long head of the biceps tendon posteriorly and the subscapularis tendon anteriorly.
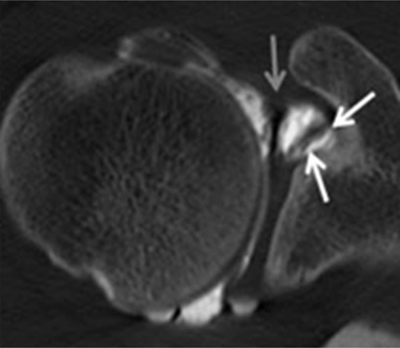
Figure 18
Coracoglenoid ligament is demonstrated on a superior axial CTA image (white arrows). It arises from the supraglenoid tubercle, covering the top of the glenoid rim and superior labrum to insert on the middle of the coracoid process. The superior glenohumeral ligament is indicated by the grey arrow.
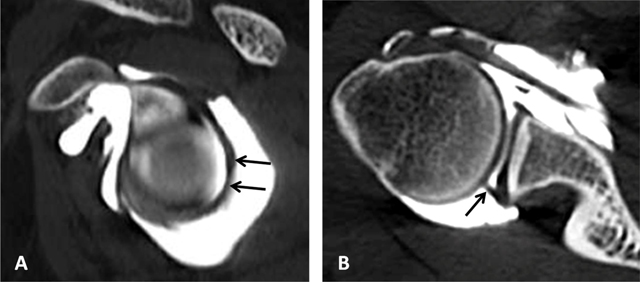
Figure 19
Posterosuperior glenohumeral ligament is demonstrated on (A) sagittal and (B) Axial CTA images (arrows, A and B). It arises from the posterosuperior part of the glenoid neck, medial to the posterosuperior labrum and the origin of the long tendon of the biceps. Laterally, it fuses with the posterior part of the rotator cable and fibers of the infraspinatus before these three structures jointly insert on the posterior facet of the greater tuberosity.
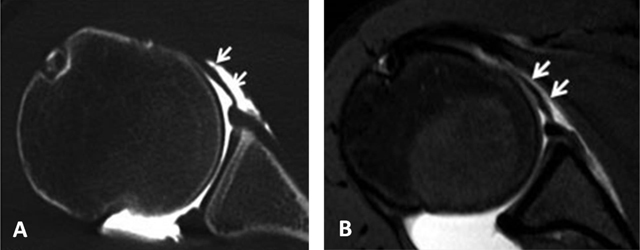
Figure 20
Middle glenohumeral ligament. The midsection of the ligament often adopts a more horizontal course. This can result in a thinner, wavier appearance on axial fat-saturated proton density MRA image (arrows, B) with a longer section of the ligament (arrows) on CTA (A).
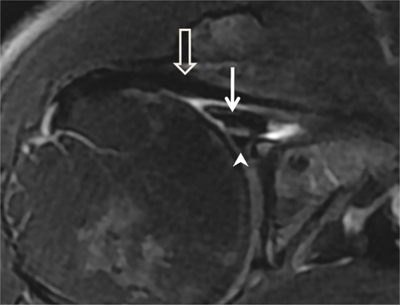
Figure 21
Cord-like middle glenohumeral ligament. Axial fat saturated T2-weighted MR image depicts a thick cord-like middle glenohumeral ligament (arrow). Subscapularis tendon (open arrow) and anterior labrum (arrowhead) are also shown on this section.
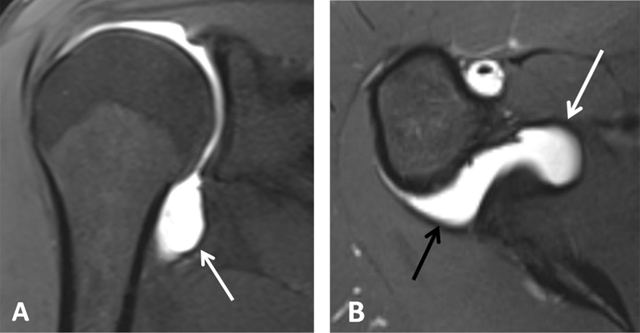
Figure 22
Inferior glenohumeral ligament. On fat-saturated T1-weighted MRA images obtained in (A) Coronal oblique and (B) Axial planes, the ligament appears as a thin hypointense band delimited by the distended axillary pouch or recess with a U-shaped appearance (arrow, A). The anterior (white arrow, B) and posterior (black arrow, B) bands are demonstrated on the axial section.
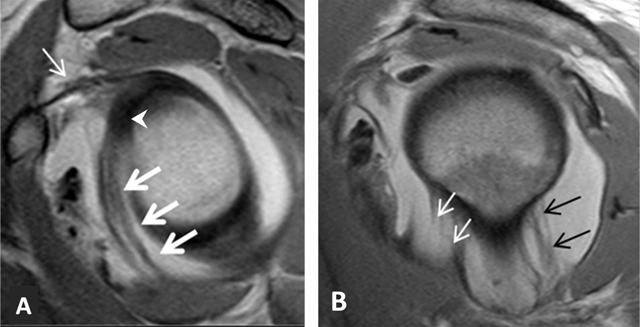
Figure 23
Inferior glenohumeral ligament. (A) Sagittal oblique PD-weighted MRA depicts the inferior glenohumeral ligament (thick arrows, A) with a high labral attachment (arrowhead, A). Coracohumeral ligament (thin arrow, A). (B) Sagittal oblique PD-weighted MRA shows the anterior band of the inferior glenohumeral ligament (white arrows, B) and the posterior band of this ligament (black arrows, B).
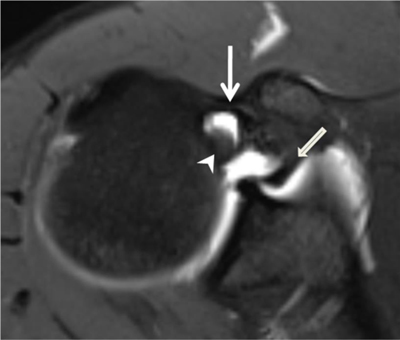
Figure 24
Pulley system. Axial fat-saturated T1-weighted MR arthrographic section at the level of the bicipital groove shows the biceps pulley (large arrow), formed by the fusion of the coracohumeral ligament, the superior glenohumeral ligament (thin arrow) and the transverse humeral ligament. The long head of the biceps tendon is pointed out by an arrowhead.