
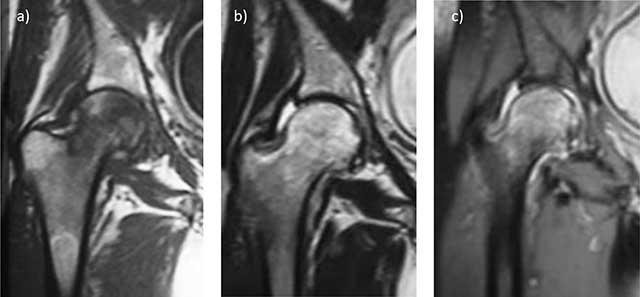
Figure 1
Transient osteoporosis of the right hip; MRI shows diffuse bone marrow edema of the femoral head extending in the femoral neck, with no fracture or osteonecrosis line. T1 spin echo (SE) coronal image a) Shows diffuse low signal of the whole femoral head. SE T2 b) and STIR c) Coronal images show heterogeneously high signal in the same area, with moderate joint effusion.
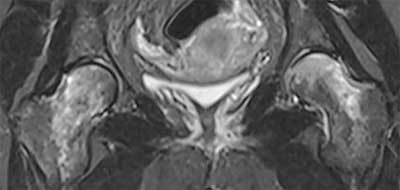
Figure 2
Transient osteoporosis of both hips postpartum. MRI coronal STIR image shows diffuse bone marrow edema of both femoral heads extending to femoral necks. There is no subchondral bone fracture, osteonecrosis line, or joint effusion.
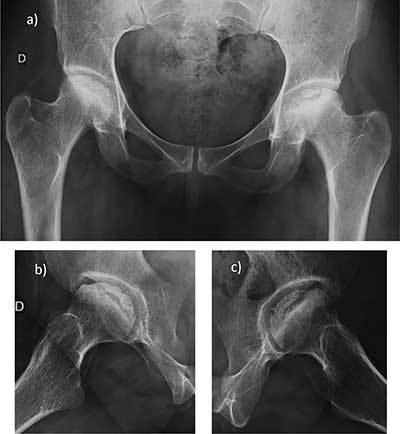
Figure 3
Bilateral osteonecrosis of the femoral heads postpartum: AP a) and lateral b) and c) Radiographs show flattening and condensation of both femoral heads.
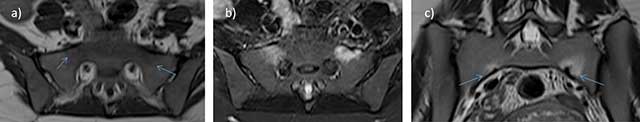
Figure 4
Stress fractures of the sacrum postpartum. Transversal T1 a), STIR b), and coronal T2 c) Images show two thin fractures lines, of low T1 and high T2 signal, located at 1–2 cm of the sacroiliac joints (arrows) and associated with bone marrow edema.
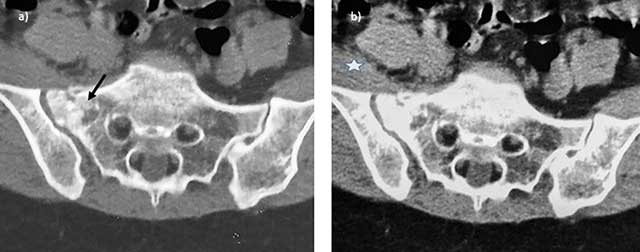
Figure 5
Stress fracture of the sacrum postpartum. Axial CT views in bone a) and soft tissue b) Reconstructions show the fracture line (arrow) of the right sacrum with soft tissue swelling (asterisk).
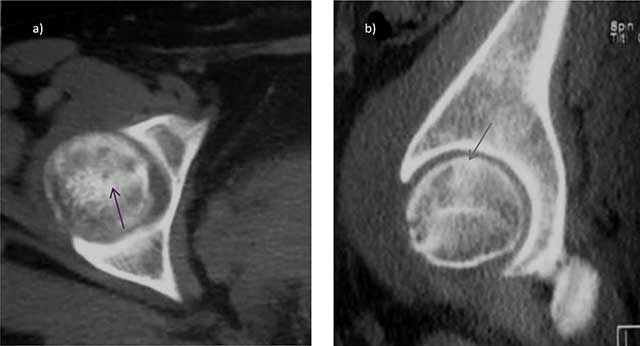
Figure 6
Stress fracture of the femoral head in the postpartum: axial a) and sagittal b) CT views show a subtle fracture line (arrows).
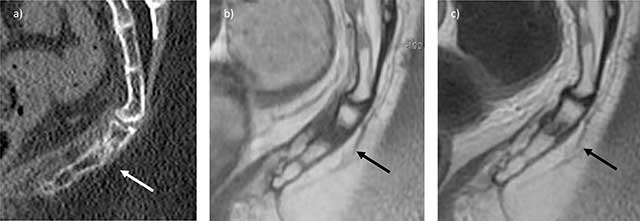
Figure 7
Stress fracture of the coccyx in the immediate postpartum. Sagittal CT view a) and T1 b) and T2 c) MRI views show the fracture line (arrow) associated with adjacent bone and soft tissue edema (courtesy Dr M. Kasbi).

Figure 8
Stress fracture of the femoral neck in the postpartum: coronal a) and sagittal b) CT views in bone reconstructions show a fracture line at the inner part of the neck (arrow).
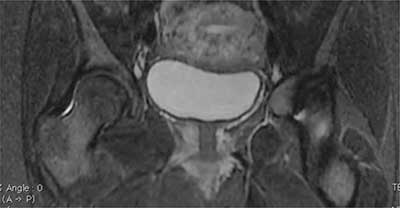
Figure 9
Symphysis pubis separation postpartum: coronal STIR MRI view shows enlargement of the joint space with bone edema of the parasymphyseal pubis bones and adjacent soft tissues.
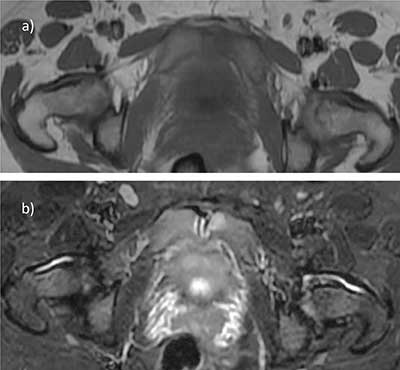
Figure 10
Postpartum symphysis pubis separation: axial T1 a) and STIR b) MRI views show high water content of the pubic cartilage with focal edematous changes to the parasymphyseal pubis bones.
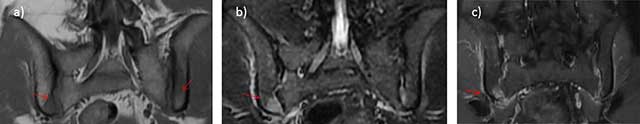
Figure 11
Bilateral inflammatory arthritis in the postpartum: coronal T1 a), STIR b), and fat-suppressed T1 after gadolinium administration c) Focal area of low T1 and high T2 signal with gadolinium enhancement of the subchondral bone in the inferior and posterior part on the joint (arrow). The same signal modifications are observed in the joint space.

Figure 12
Inflammatory arthritis of sacroiliac joints in the postpartum: axial STIR a) and b) and frontal STIR c) MRI images show high signal intensity of the right and left joint space (*), subchondral bone (–>), and soft tissue (>) with no fluid collection.
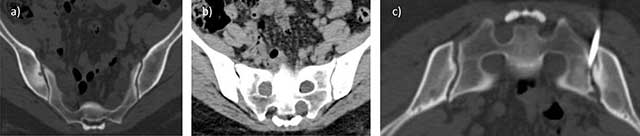
Figure 13
Inflammatory arthritis of the right SI joint of the postpartum in a 36-year-old woman with elevated ESR. Axial CT images in bone a) and soft tissue b) Algorithm: subchondral bone erosions and condensation of the inferior part of the right SI joint with no soft tissue swelling. CT-guided biopsy did not show any evidence of infection.
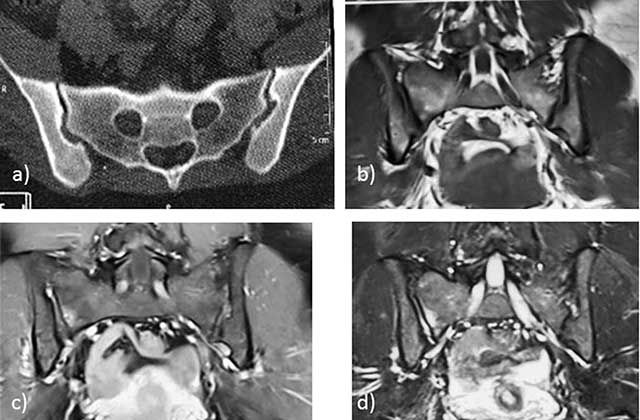
Figure 14
Inflammatory arthritis of the right SI joint of the postpartum in a 27-year-old woman. Axial CT image a) subtle ossifications of the extra-synovial part of the SI joint. T1-weighted b) and STIR c) and d) MR images: low T1 and high T2 signal intensity of the right SI joint cavity with high T1 and STIR signal of the subchondral bone.
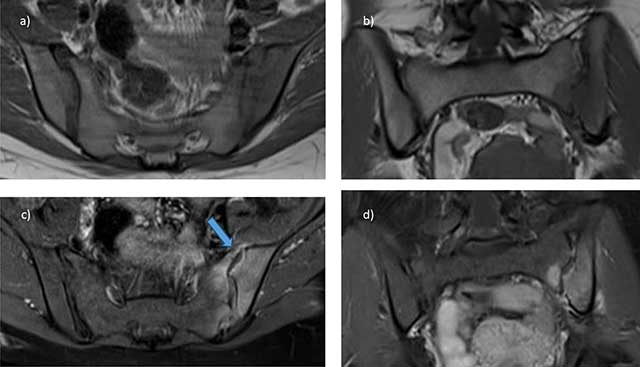
Figure 15
Pyogenic arthritis of the left sacroiliac joint in the postpartum: axial a) and coronal b) T1 MR images, as well as axial c) and coronal d) Fat-suppressed T1 MRI images after gadolinium administration show fluid collection in the joint space (arrow), associated with bone and soft tissue edema.