
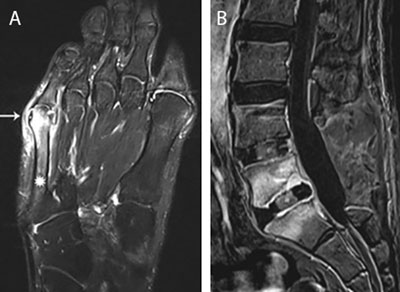
Figure 1
Main routes of infectious spread. (a) Infectious spread from contiguous infected tailors bunion. Axial T1-weighted image (WI) with Fat Suppression (Fat–Sat) after gadolinium contrast administration shows an inflamed bunion (white arrow) with adjacent enhancement of the distal aspect of the 5th metatarsal (asterisks). (b) Postoperative infectious spread. Postoperative spinal infection. Sagittal T1–WI with Fat–Sat after gadolinium contrast administration. Note laminectomy L4 and L5 with placement of intervertebral cages. Extensive enhancement of L5 and S1 with rim enhancement of the intervertebral cage L5–S1 in keeping with postoperative spondylodiscitis.
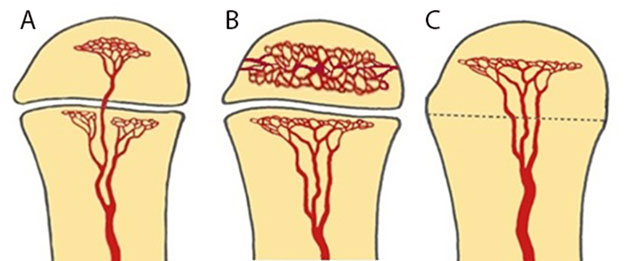
Figure 2
Schematic drawing of vascularization of the long bone, modified from Resnick. [2]. (a) Schematic drawing of vascularization of the long bone in infants younger than 18 months. There are metaphyseal and transphyseal blood vessels allowing metaphyseal and epiphyseal origin of infection. (b) Schematic drawing of vascularization of the long bone in children between 18 months and 16 years. The epiphysis has its own nutrient vessels (veins and arteries) whilst the metaphysis and diaphysis share the same vessels. A natural barrier is formed by the physis preventing spread of osteomyelitis in the epiphysis and joints. Therefore, children of this age group will present with an initial and predominant metaphyseal focus of infection. (c) Schematic drawing of vascularization of the long bone in adults after closure of the growth plate. From 16 years on restoration of the transphyseal vascularization may cause potential epiphyseal spread of infection.
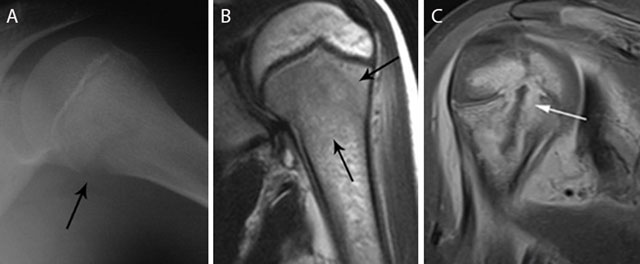
Figure 3
Acute osteomyelitis in 2 different patients. Plain radiograph (a) and coronal T2–WI (b) of acute osteomyelitis in the left proximal humerus. Another example of a child with osteomyelitis in the right proximal humerus (c) on coronal T1–WI with FS after gadolinium contrast administration. Standard radiography (a) shows a subtle osteolytic lesion at the metaphysis and loss of cortical delineation of the medial humerus (black arrow). The surrounding bone marrow edema (black arrows) (b) is restricted to the metaphysis in most cases of childhood osteomyelitis. The relativity of the barrier of the growth plate on MRI is illustrated in (c) Although a rim-enhancing intra-osseous abscess (white arrow) corresponding with the main site of infection is located at the metaphysis, there is also focal enhancement of the growth plate and epiphysis, in keeping with metaphyseal crossing.
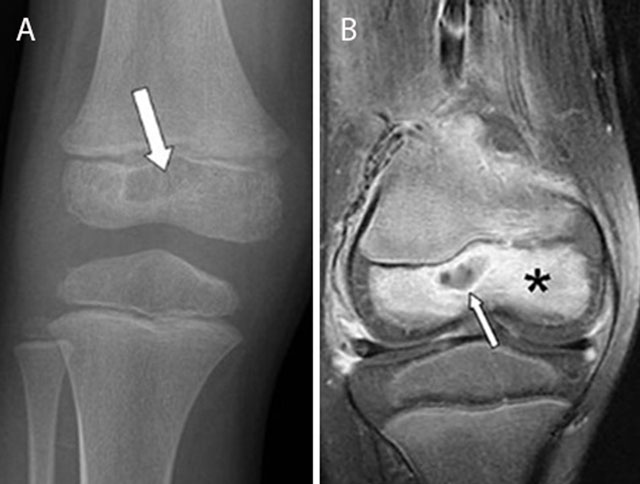
Figure 4
Epiphyseal childhood osteomyelitis of the right knee. Plain radiograph (a) of the distal femur shows a radiolucent lesion with peripheral sclerotic rim (white arrow) in the epiphysis of the distal femur. After gadolinium contrast administration (coronal T1–Fat–Sat WI, (b) the central part of the lesion is non-enhancing whereas there is subtle peripheral rim enhancement (white arrow) with moderate enhancement of the surrounding bone marrow edema.
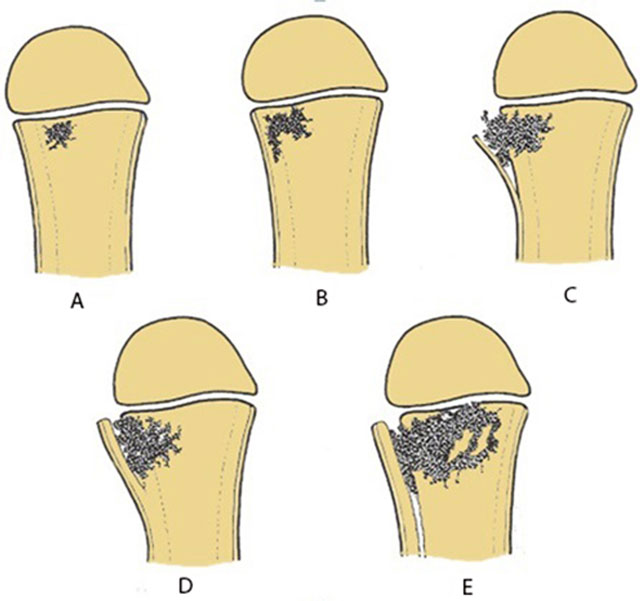
Figure 5
Schematic drawing of the consecutive events of acute osteomyelitis. (a) Initial metaphyseal focus. (b) Lateral spread to the cortex. (c) Cortical penetration and periosteal elevation. (d) Formation of thick involucrum. (e) Further expansion metaphyseal focus with extensive involucrum.
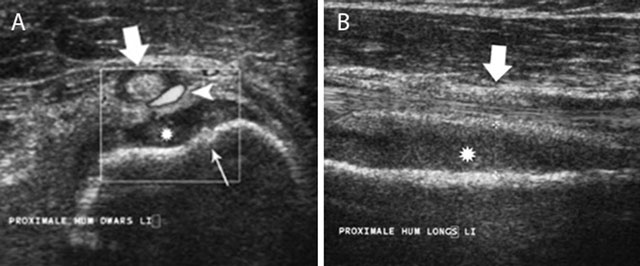
Figure 6
Acute childhood osteomyelitis of the proximal humerus on ultrasound. Transverse (a) and longitudinal (b) ultrasound images of the proximal humerus. Note focal thinning of the humeral cortex (thin white arrow) on the axial images in keeping with a cortical penetration of the infection causing subperiosteal pus collection (asterisk). There is also increased Doppler signal (white arrow head) within the synovium of the long head of the biceps tendon (large white arrow).
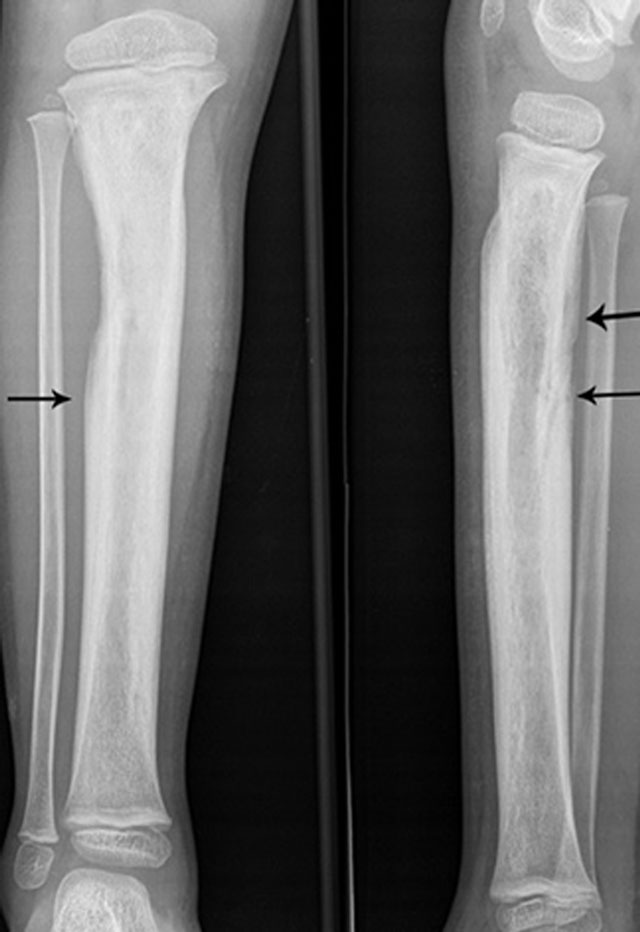
Figure 7
Extensive involucrum on plain radiography. Anteroposterior and lateral plain radiography showing extensive involucrum (arrow) at the tibial diaphysis (black arrows).
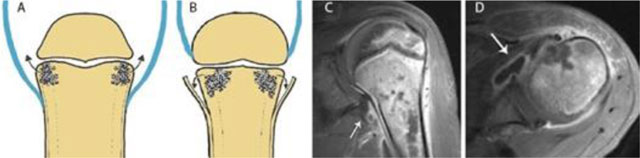
Figure 8
Joint contamination in osteomyelitis. Schematic drawings (a) and (b), coronal (c) and axial (d) T1–WI Fat–Sat after gadolinium contrast administration. (a) shows a joint in which the joint capsule (blue) is attaching underneath the growth plate. This intra-articular location of the growth plate may lead to rapid spread of infection into the adjacent joint. (b) shows a joint in which the joint capsule (blue) is attaching above the growth plate. An extra-articularly located growth plate protects against early joint contamination. (c, d). Example on MRI of a patient with rapid spread of the infectious focus to the adjacent left shoulder joint. Because the joint capsule of the shoulder insert below the growth plate, metaphyseal osteomyelitis may easily spread through the medial cortex directly into the joint resulting in synovial enhancement (white arrow).
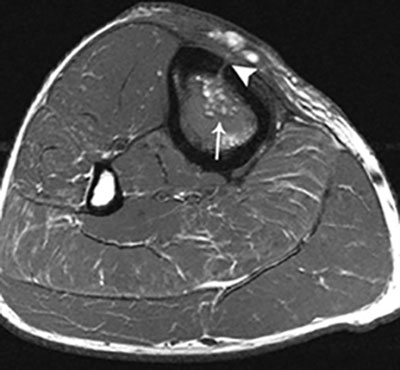
Figure 9
Fat globule sign on T1–WI. Axial T1–WI showing fat globules (white arrow) within the bone marrow edema of the tibia. In addition, there is a cortical defect – also known as the cloaca – perforating the ventromedial cortex of the tibia (white arrowhead).
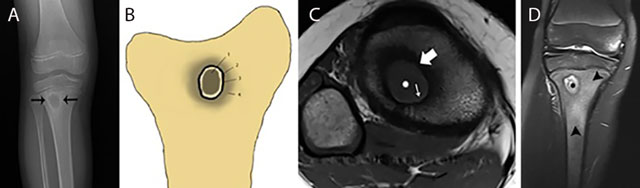
Figure 10
Typical Brodie abscess in subacute osteomyelitis of the tibia. Plain radiograph (a) Schematic drawing (b) Axial T1–WI (c) and coronal Fat–Sat T2–WI (d) Plain radiograph (a) shows a focal area of metaphyseal osteolysis with a peripheral rim of reactive sclerosis (black arrows). (b) shows a the different layers of Brodie abscess on T1–WI with a the pathognomonic penumbra sign on axial T1–WI (c) and a pus-filled collection on coronal Fat–Sat T2–WI (d). Central pus of intermediate to low SI on T1–WI (white asterisks on c) and high SI on T2–WI (black asterisks on d). Internal abscess wall consisting of granulation tissue of high SI on T1–WI (penumbra sign) (white small arrow on c) and intermediate SI on T2–WI. External ring of reactional sclerosis of low SI on both T1–WI (white large arrow on c) and T2–WI. Peripheral bone marrow edema of intermediate to low SI on T1–WI and high SI on T2–WI (black arrowheads on d).
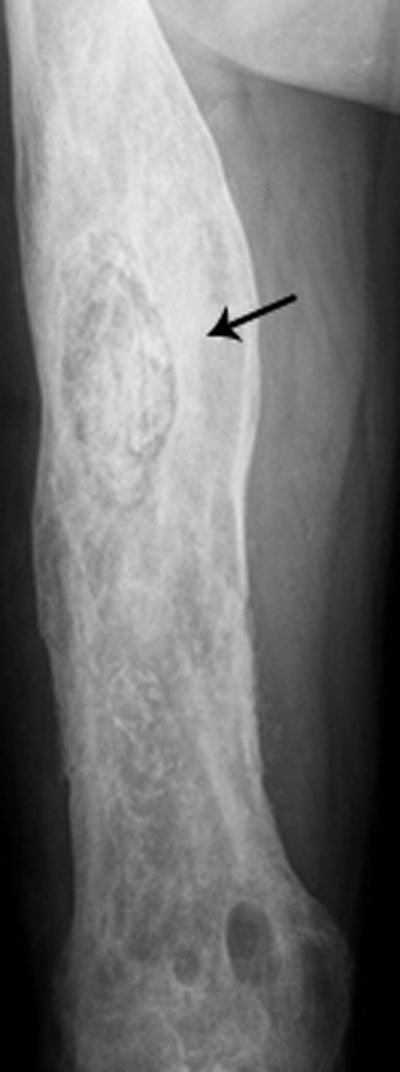
Figure 11
Chronic osteomyelitis on plain radiograph of the femur. Plain radiograph shows diffuse inhomogeneous osteosclerosis of the right femur with a focal area of increased opacity representing necrotic bone or sequestrum (black arrow). Plain films are often difficult to interpret because of superposition of viable and necrotic bone each with a different radiopacity.
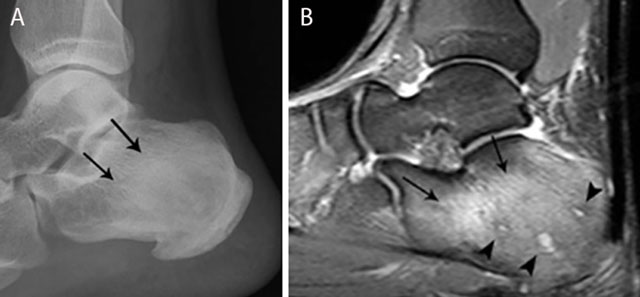
Figure 12
Chronic osteomyelitis of the calcaneus. Plain radiograph (a) and sagittal Fat–Sat T2–WI (b). Plain radiograph (a) shows inhomogeneous sclerosis (black arrows) in the calcaneus. Bone marrow edema (black arrows) is seen on MRI imaging (b), representing active infection. Note also the presence of small micro-abscesses (black arrowheads).
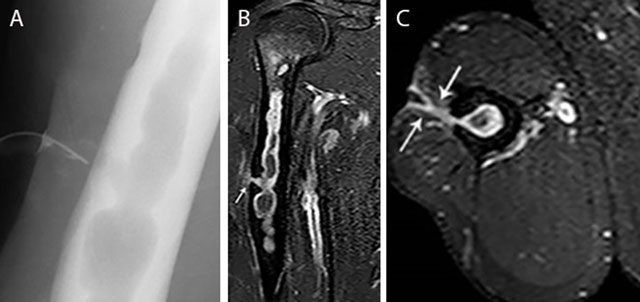
Figure 13
Chronic osteomyelitis of the right humerus with fistula formation. Plain radiograph (sinography) (a), coronal (b) and axial (c) Fat–Sat T1–WI after gadolinium contrast administration. The sinography (a) shows an intramedullary well defined lytic lesion with scalloping of the cortex. Note the presence of a catheter in the sinus. There is enhancement of the wall of the intra-osseous abscess and the wall of the fistula (white arrow) (b, c). Image courtesy Dr. H. Declercq, Dendermonde.
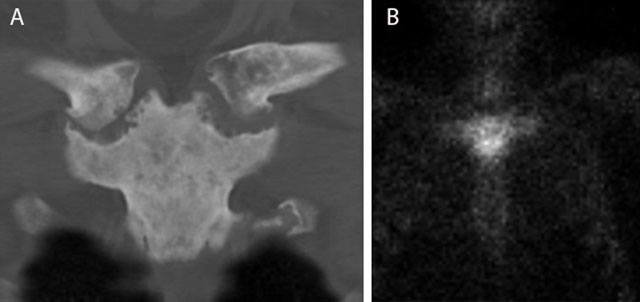
Figure 14
Typical bullhead sign in SAPHO of the sternoclavicular joint. CT (coronal reformatted image) (a) shows sclerosis of the manubrium sterni and medial clavicles and erosions of the sternoclavicular joints. Note a typical bullhead sign on scintigraphy (b).
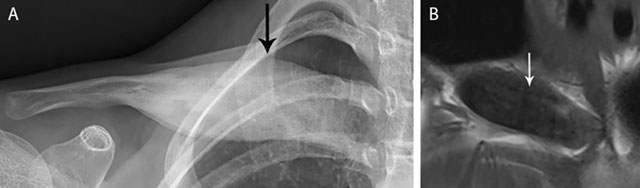
Figure 15
CRMO of the medial clavicle. Plain radiograph (a) shows an expansile lesion (black arrow) of the medial clavicle with extensive bone sclerosis and a solid periosteal reaction. The lesion is of hypo-intense signal on coronal T1–WI (b). Note osseous expansion of the lesion beyond the original cortex of the clavicle (white arrow).