
| RESEARCH QUESTION | HYPOTHESIS | ANALYSIS PLAN | SAMPLING PLAN | RATIONALE FOR THE TESTS | INTERPRETATION GIVEN DIFFERENT OUTCOMES | THEORY THAT COULD BE SHOWN WRONG BY THE OUTCOMES |
|---|---|---|---|---|---|---|
| Do previous moral behaviors that give one moral credentials make people more likely to engage in morally questionable behaviors later? | Moral credentials make people more likely to engage in subsequent morally questionable acts. | ANOVA | Amazon Mechanical Turk via CloudResearch (with .90 power to detect a d = 0.25 credential effect) | We used the same test as in our replication target (Study 2 in Monin & Miller, 2001), albeit with a minor tweak to test our extension hypothesis. | There could be multiple reasons behind a non-replication. Our evaluation of the replication outcomes will follow LeBel et al.’s (2019) criteria. | The moral credential model of moral licensing |
| Do moral credentials work better in licensing immoral behaviors in the same domain than in a different domain? | Moral credentials work better in licensing immoral behaviors in the same domain than in a different domain. | N/A | Ambiguous moral transgressions (in the study: expression of conceivably prejudiced preference) are better licensed by credentials in the same domain than in a different domain (Effron & Monin, 2010). | |||
| Is trait reputational concern negatively associated with the expression of conceivably prejudiced preferences? | Trait reputational concern is negatively associated with the expression of conceivably prejudiced preferences. | Multiple linear regression | We want to examine whether and under what conditions (particularly, with vs. without credentials) do reputational concern predicts expression of conceivably prejudiced preferences. | N/A | N/A | |
| Do moral credentials moderate the relationship between reputational concern and the expression of conceivably prejudiced preferences? | Moral credentials attenuate the negative association between reputational concern and the expression of conceivably prejudiced preferences. | N/A | N/A |
[i] Note. N/A = Not Applicable.
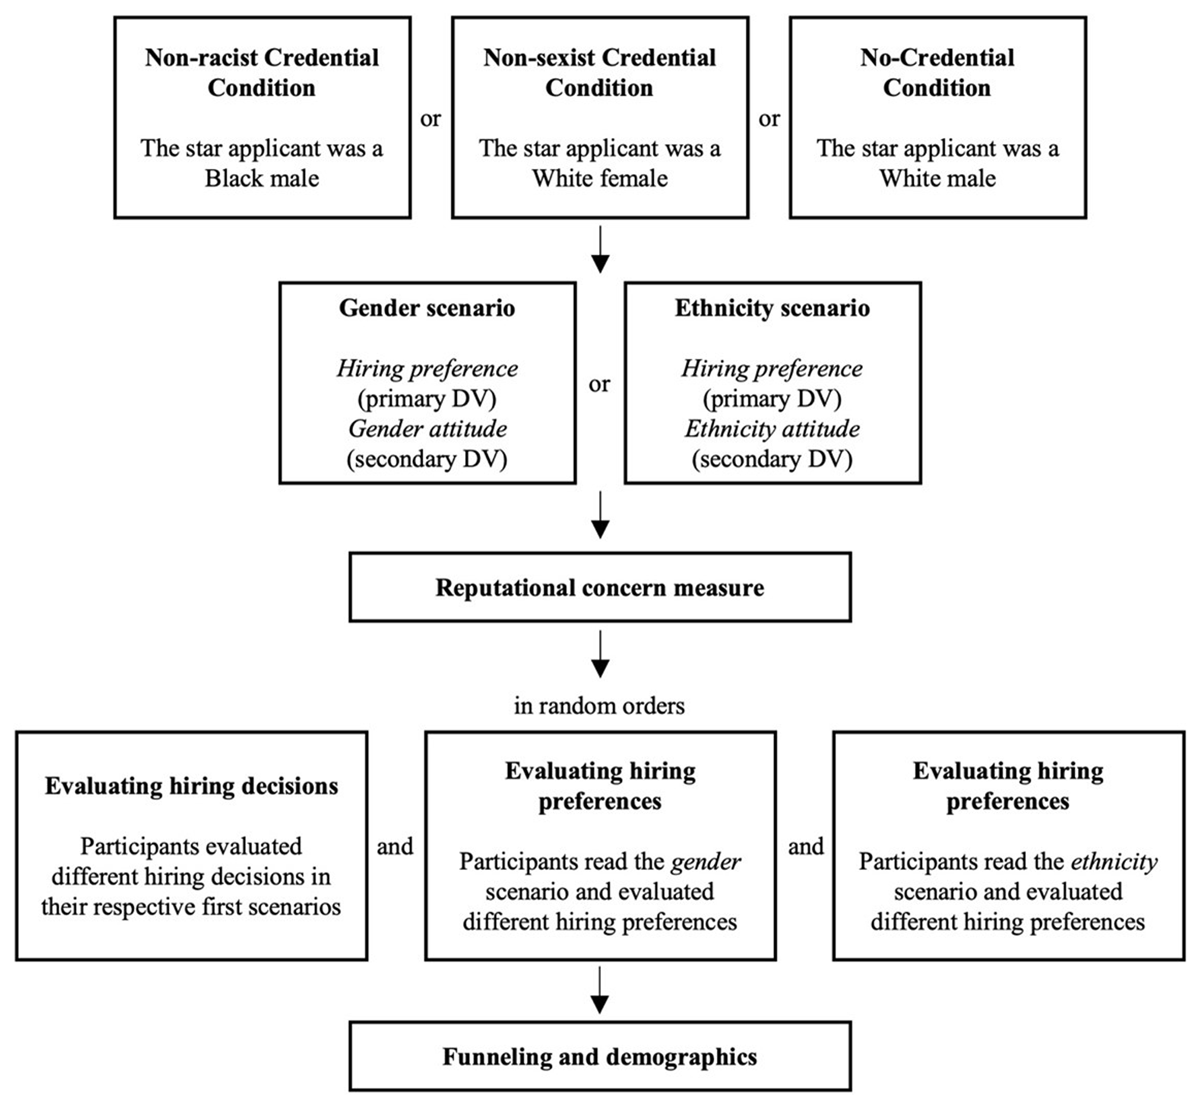
Figure 1
Flow of the study.
Table 1
Descriptive statistics and standardized effect sizes.
| DESCRIPTIVES (MEAN (SD) [n]) | COHEN’S d | 95% CI | |||||
|---|---|---|---|---|---|---|---|
| SCENARIO | COMPARISON (A – B) | RELEVANT HYPOTHESIS | CONDITION A | CONDITION B | LL | UL | |
| Including participants who did not choose the star applicant | |||||||
| Ethnicity | R – N | H1 | 1.00 (1.12) [138] | 0.96 (1.05) [140] | 0.04 | –0.19 | 0.27 |
| R – S | H2 | – | 0.82 (1.06) [144] | 0.17 | –0.06 | 0.39 | |
| S – N | Exploratory | – | – | –0.13 | –0.35 | 0.10 | |
| Gender | S – N | H1 | 0.73 (0.87) [154] | 1.10 (1.01) [153] | –0.39 | –0.62 | –0.16 |
| S – R | H2 | – | 1.09 (1.03) [145] | –0.37 | –0.61 | –0.14 | |
| R – N | Exploratory | – | – | –0.01 | –0.25 | 0.22 | |
| Excluding participants who did not choose the star applicant | |||||||
| Ethnicity | R – N | H1 | 1.01 (1.11) [120] | 0.99 (1.06) [106] | 0.02 | –0.24 | 0.29 |
| R – S | H2 | – | 0.79 (1.04) [124] | 0.20 | –0.05 | 0.45 | |
| S – N | Exploratory | – | – | –0.19 | –0.45 | 0.07 | |
| Gender | S – N | H1 | 0.67 (0.85) [133] | 1.13 (1.00) [119] | –0.49 | –0.75 | –0.23 |
| S – R | H2 | – | 1.09 (1.04) [115] | –0.44 | –0.70 | –0.18 | |
| R – N | Exploratory | – | – | –0.04 | –0.29 | 0.23 | |
[i] Note. R = non-racist credential condition, S = non-sexist credential condition, N = no-credential condition. We expected positive ds with comparisons associated with H1 and H2, and non-negative ds for exploratory comparisons. Repetitive descriptive statistics are omitted. Excluding participants who did not choose the star did not result in qualitatively different results. 95% confidence intervals were estimated with first-order normal approximation bootstrapping method.

Figure 2
Hiring preferences by credential condition, scenario, and whether those who did not choose the star applicant were excluded. Error bars represent 95% confidence intervals.

Figure 3
No evidence that moral credentials moderated the association between trait-level reputational concern and expressing potentially problematic hiring preferences. Those who did not choose the star applicant were included. Dots jittered vertically.
Table 2
Descriptive statistics for evaluations of hiring decisions.
| EXPLORATORY QUESTION | CREDENTIAL CONDITION | DESCRIPTIVES – MEAN (SD) | CONDITION × CANDIDATE STATUS INTERACTION | CONTRAST | ||||
|---|---|---|---|---|---|---|---|---|
| STAR | NON-STARS AGGREGATED | F(2, 929) | p | ηp2 | t | p | ||
| Racism | No | 1.74 (0.76) | 1.73 (0.68) | 106.16 | <.001 | .186 | 0.20 | .841 |
| Non-racist | 1.38 (0.63) | 1.99 (0.74) | –19.12 | <.001 | ||||
| Non-sexist | 1.57 (0.71) | 1.69 (0.73) | –3.67 | <.001 | ||||
| Sexism | No | 1.79 (0.83) | 1.78 (0.74) | 90.71 | <.001 | .163 | 0.32 | .747 |
| Non-racist | 1.61 (0.73) | 1.73 (0.79) | –3.31 | .001 | ||||
| Non-sexist | 1.41 (0.66) | 2.07 (0.80) | –17.70 | <.001 | ||||
| Morality | No | 3.40 (0.96) | 3.20 (0.84) | 10.92 | <.001 | .023 | 4.41 | <.001 |
| Non-racist | 3.66 (0.92) | 3.20 (0.80) | 10.15 | <.001 | ||||
| Non-sexist | 3.67 (0.91) | 3.23 (0.81) | 9.88 | <.001 | ||||
| Immorality | No | 2.35 (1.13) | 2.22 (0.92) | 14.13 | <.001 | .030 | 2.54 | .011 |
| Non-racist | 2.87 (1.26) | 2.34 (0.90) | 9.62 | <.001 | ||||
| Non-sexist | 2.70 (1.19) | 2.27 (0.90) | 7.91 | <.001 | ||||

Figure 4
Participants’ evaluations of different hiring decisions in the first scenario. Edwards was the star applicant in all conditions. Black dots represent mean values (error bars were not plotted as they were too narrow to be visually informative).

Figure 5
Participants’ evaluations of different hiring preferences (A) in the gender scenario and (B) in the ethnicity scenario. Own scenario is the scenario that they went through themselves. Dots and lines represent mean values and 95% CI.
Table 3
Evaluating replication outcomes.
| ORIGINAL | REPLICATION | EVALUATION | |||
|---|---|---|---|---|---|
| d | 95% CI | SCENARIO | d | 95% CI | |
| Including those who did not choose the star | |||||
| 0.44 | [0.09, 0.79] | Gender | –0.38 | [–0.61, –0.14] | Signal – inconsistent, opposite |
| Ethnicity | 0.08 | [–0.14, 0.30] | No signal – inconsistent | ||
| Excluding those who did not choose the star | |||||
| 0.59 | [0.20, 0.98] | Gender | –0.50 | [–0.75, –0.24] | Signal – inconsistent, opposite |
| Ethnicity | 0.03 | [–0.23, 0.27] | No signal – inconsistent | ||
[i] Note. For direct comparison, here we included those who indicated preferences towards women/Blacks when calculating the replication effect sizes, as these participants were included in the analysis in the original study.