
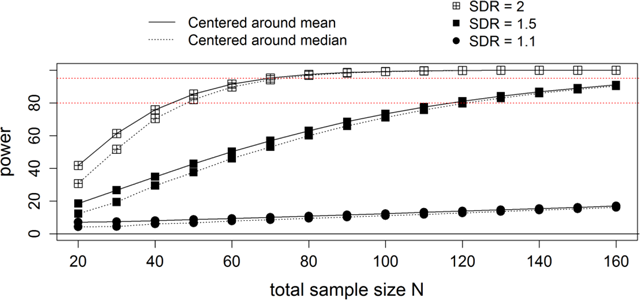
Figure 1
Estimated power of Levene’s test as a function of sample size, SDR and centering parameter.
Table 1
Comparison of t-value and Degrees of Freedom of Welch’s and Student’s t-test.
| Equal variances | Unequal variances | |
|---|---|---|
| Balanced design | tWelch = tStudent | tWelch = tStudent |
| dfWelch = dfStudent | dfWelch ≠ dfStudent | |
| pWelch = pStudent | pWelch ≠ pStudent | |
| Unbalanced design | tWelch = tStudent | tWelch ≠ tStudent |
| dfWelch ≠ dfStudent | dfWelch ≠ dfStudent | |
| pWelch ≠ pStudent | pWelch ≠ pStudent |
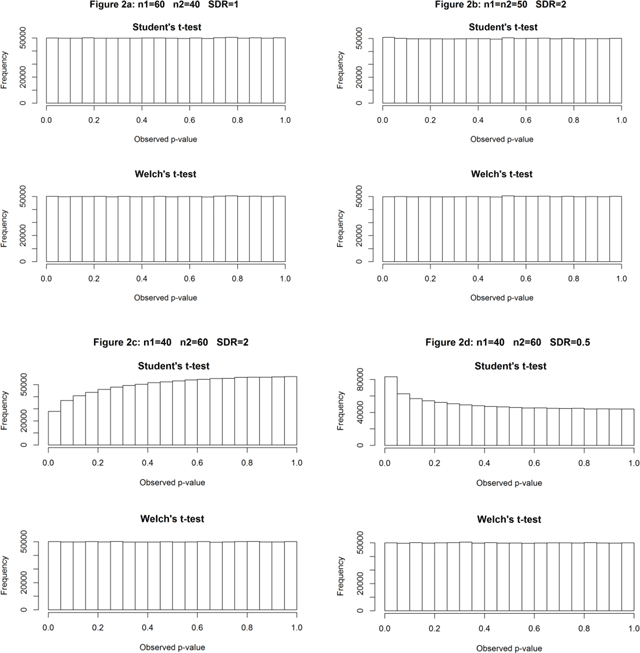
Figure 2
P-value distributions for Student’s and Welch’s t-test under the null as a function of SDR, and sample size.
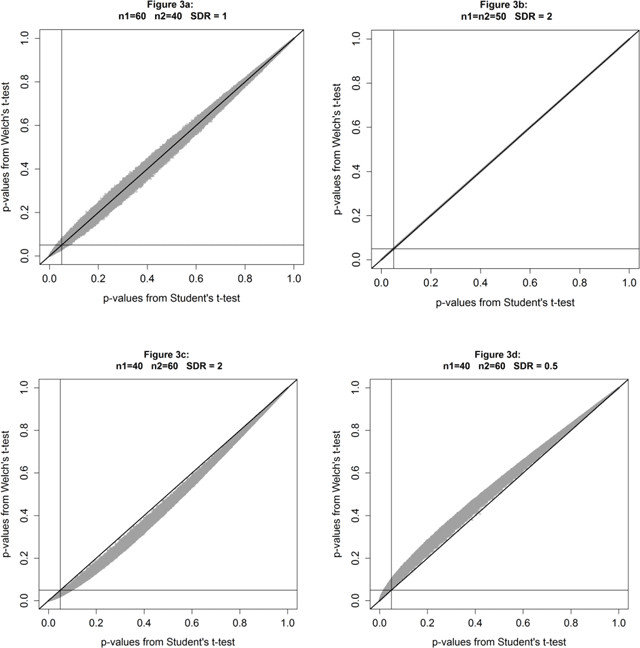
Figure 3
P-values from Student’s t-test against p-values from Welch’s t-test under the null.