
Table 1
Means, standard deviations, and inter-correlations between the main variables in Study 1.
| VARIABLE | M | SD | 1 | 2 | 3 | 4 |
|---|---|---|---|---|---|---|
| 1. National Identification | 4.99 | 1.26 | ||||
| 2. SDO | 2.29 | 1.21 | .30*** | |||
| 3. Historic Laïcité | 6.33 | 0.77 | –.16** | –.53*** | ||
| 4. New Laïcité | 4.94 | 1.37 | .31*** | .25*** | –.04 | |
| 5. BLM support | 3.10 | 1.07 | –.34*** | –.69*** | .35*** | –.40*** |
[i] Note: N = 305, * Indicates p < .05, ** p < .01, *** p < .001.
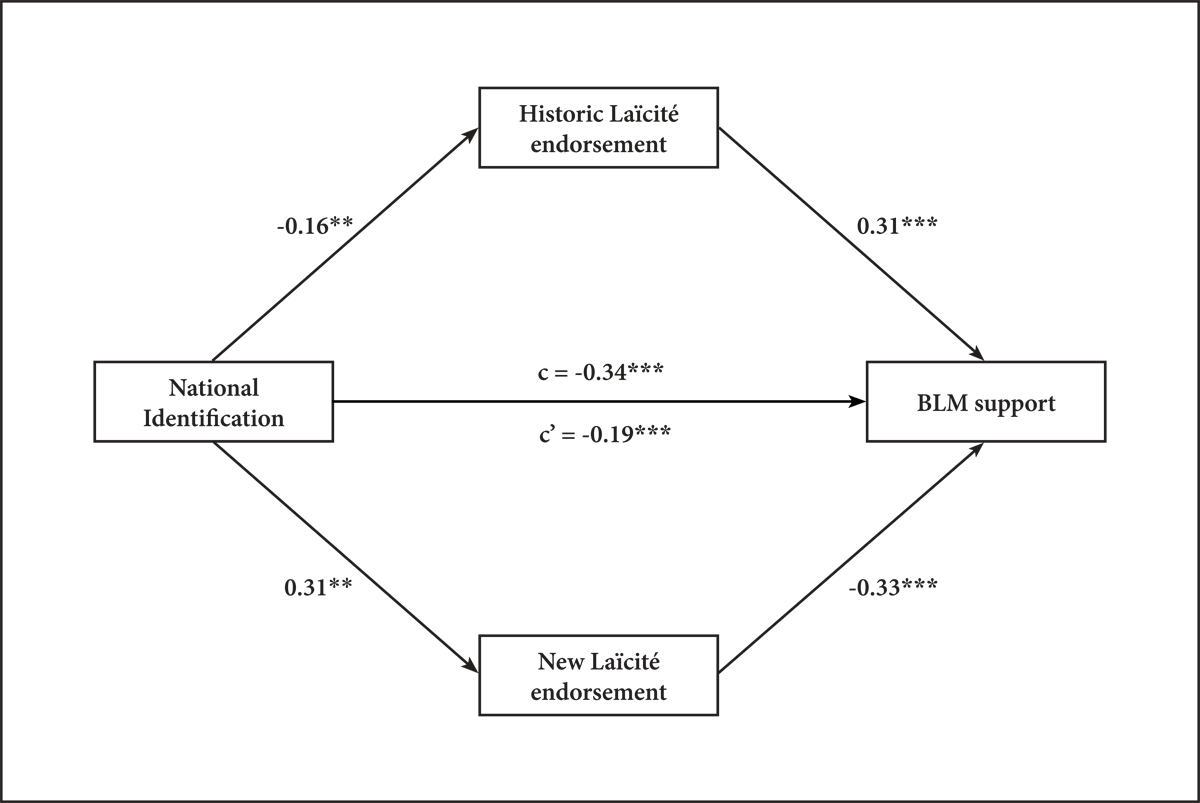
Figure 1
Mediation model of National Identification on BLM support via the endorsement of Laïcité norms.
Note: coefficients are standardized in our sample (N = 305). c represents the total effect and c’ the direct effect of NI on BLM support. * Indicates p < .05; ** p < .01; *** p < .001.
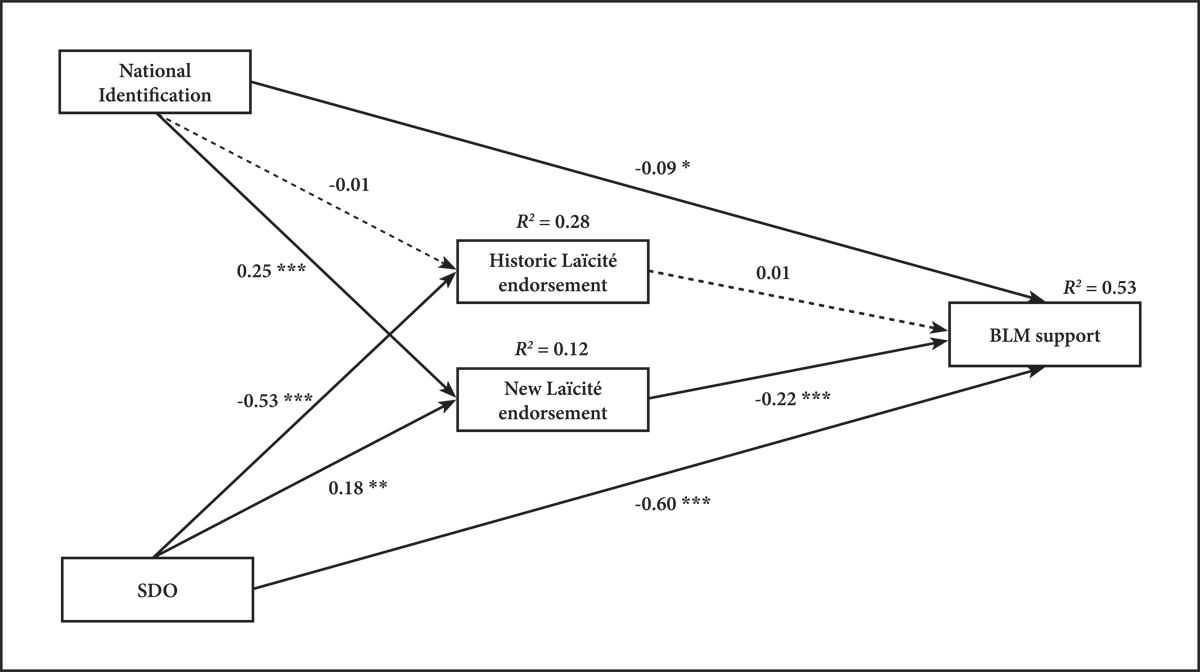
Figure 2
Path analysis including nationally-grounded and cross-national paths predicting BLM support.
Note: Estimates path coefficients are standardized, and R2 indicates explained variance. Full lines represent significant paths and broken lines represent nonsignificant paths. * p indicates < .05; ** p < .01; *** p < .001.
Table 2
Means, standard deviations, and inter-correlations between the main variables in Study 2.
| VARIABLE | M | SD | 1 | 2 | 3 | 4 |
|---|---|---|---|---|---|---|
| 1. National Identification | 4.96 | 1.19 | ||||
| 2. SDO | 2.47 | 1.13 | .29*** | |||
| 3. Historic Laïcité | 6.17 | 0.94 | –.10* | –.44*** | ||
| 4. New Laïcité | 4.85 | 1.48 | .32*** | .25*** | –.08 | |
| 5. BLM | 3.35 | 1.11 | –.32*** | –.58*** | .45*** | –.42*** |
[i] Note: N = 489 * Indicates p < .05, ** p < .01, *** p < .001.
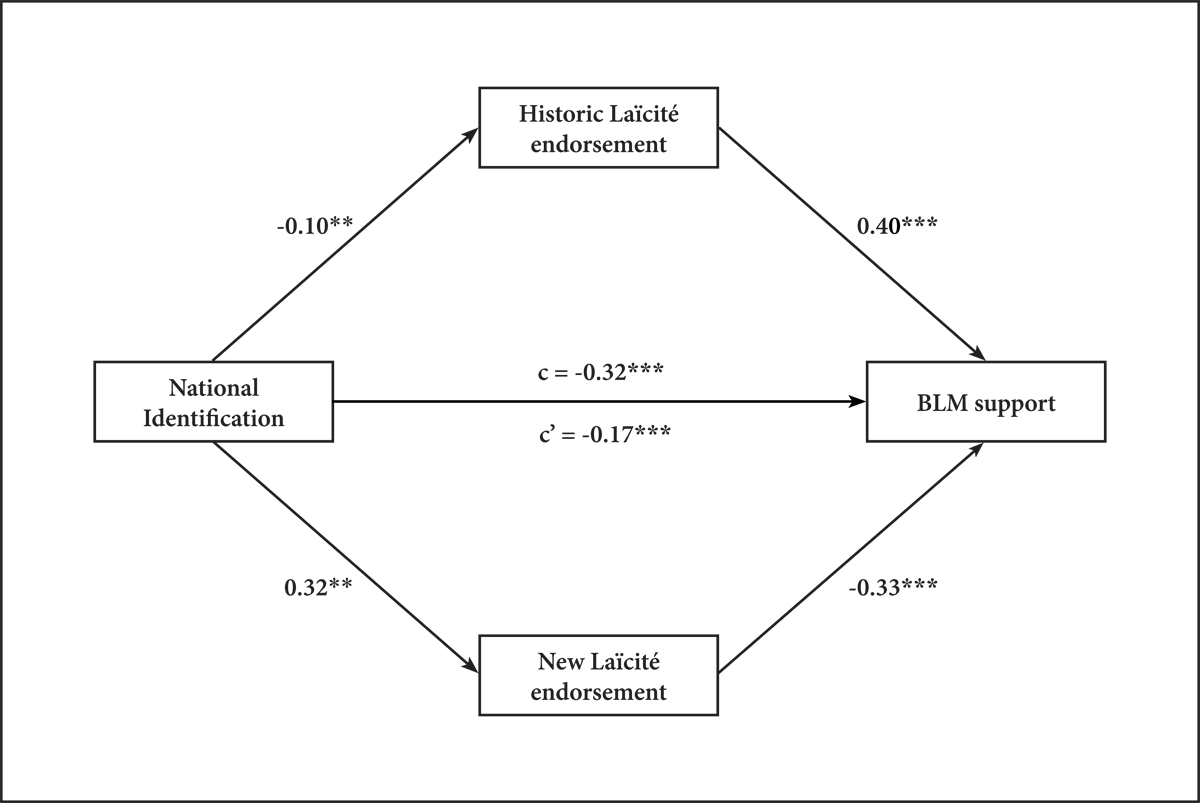
Figure 3
Replication of the mediation model of National Identification on BLM support via the endorsement of Laïcité norms.
Note: Coefficients are standardized in our sample (N = 489). c represents the total effect and c’ the direct effect of NI on BLM support. * Indicates p < .05; ** p < .01; *** p < .001.
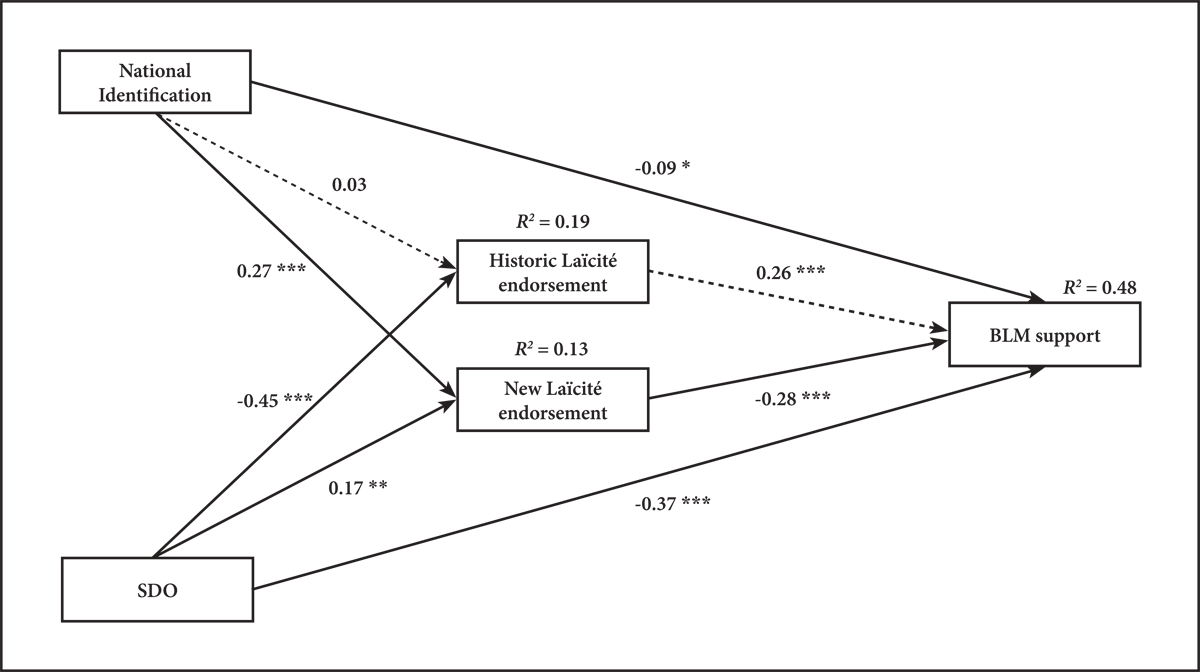
Figure 4
Replication of the path analysis including nationally-grounded and cross-national paths predicting BLM support.
Note: Path coefficients are standardized, and R2 indicates explained variance. Full lines represent significant paths and broken lines represent nonsignificant paths. * p indicates < .05; ** p < .01; *** p < .001.