
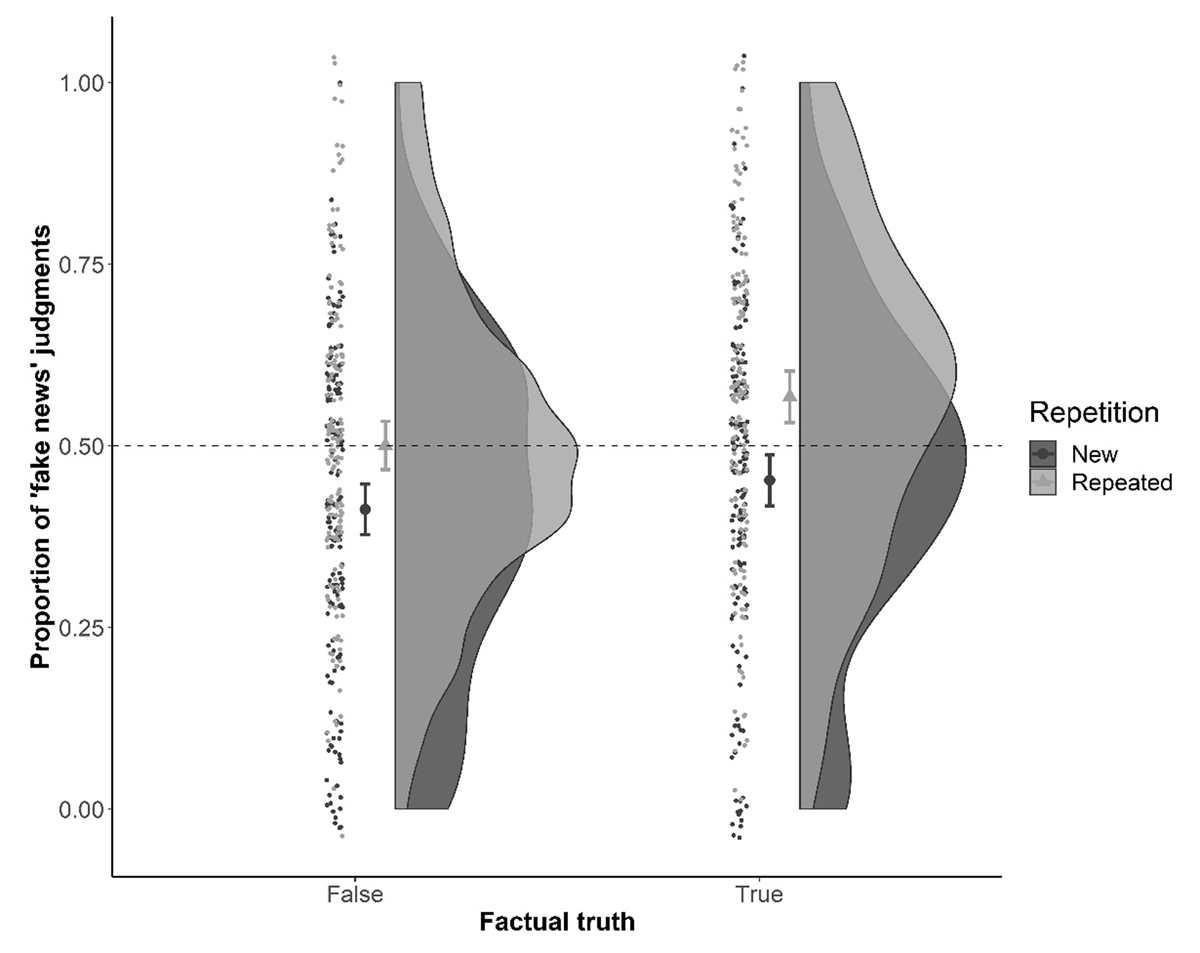
Figure 1
Proportions of ‘used as fake news on social media’ judgments as a function of Repetition (dashed horizontal line: no bias toward the ‘yes, fake news’ or the ‘no, not fake news’ side) and Factual truth in Experiment 1. The dots are participants’ scores (jittered). The error bars are the 95% confidence intervals, with the mean in between. The distributions are the kernel probability density of the data (trimmed to remain within the range of possible values, 0 to 1).
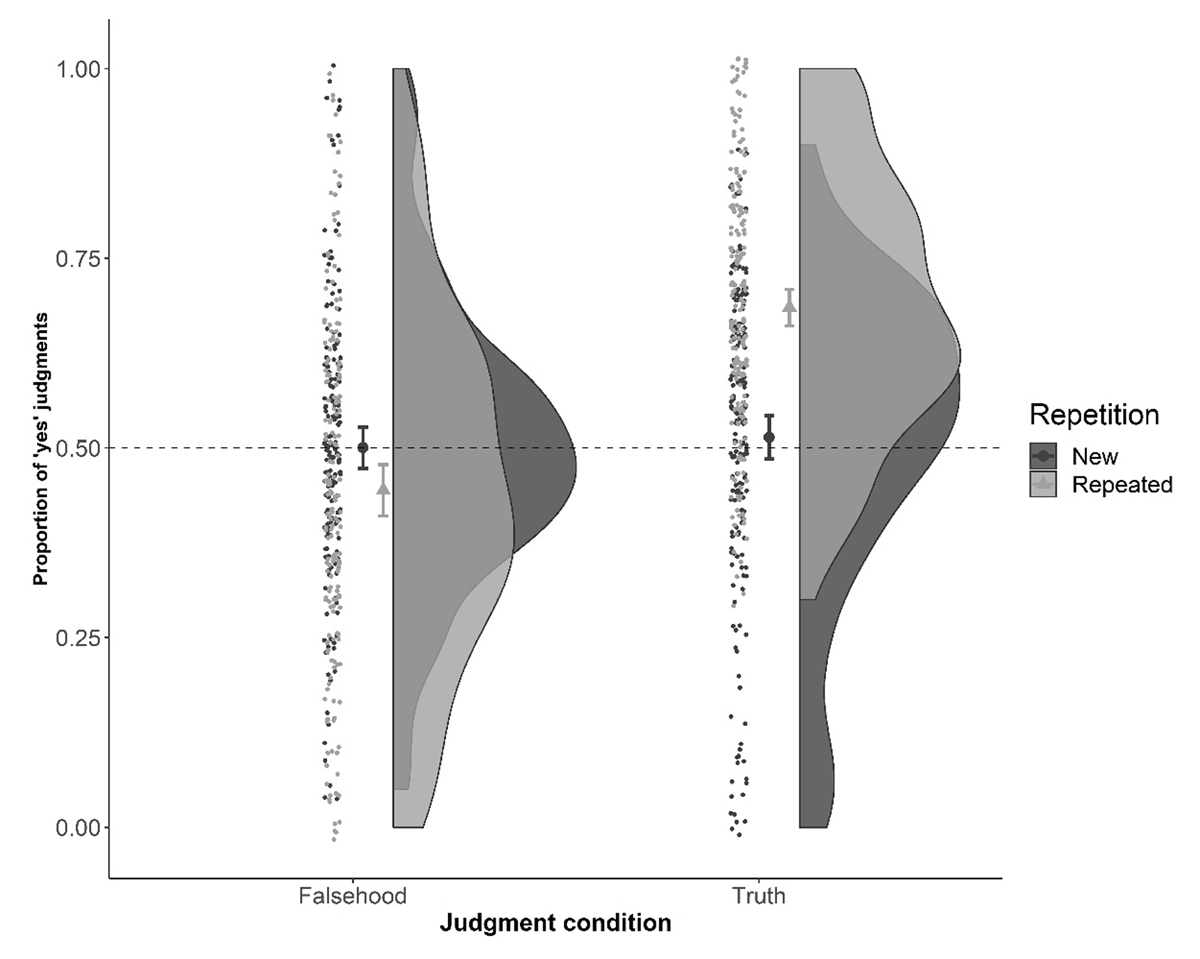
Figure 2
Proportions of ‘yes’ judgments as a function of Repetition (dashed horizontal line: no bias toward the ‘yes’ or the ‘no’ side) and Judgment condition in Experiment 2. The dots are participants’ scores (jittered). The error bars are the 95% confidence intervals, with the mean in between. The distributions are the kernel probability density of the data (trimmed to remain within the range of possible values, 0 to 1).