

Figure 1
Attributions of free will in the function of the convenience store scenarios.
Table 1
Means and standard deviations for all dependent variables for every type of event and scenario.
| SCENARIO | HITCHHIKER | CAR ACCIDENT | CONVENIENCE STORE | |||||||||
|---|---|---|---|---|---|---|---|---|---|---|---|---|
| TYPE OF EVENT | ROUTINE(N = 282) | EXCEPTIONAL(N = 279) | ROUTINE(N = 280) | EXCEPTIONAL(N = 281) | ROUTINE(N = 280) | EXCEPTIONAL(N = 281) | ||||||
| ATTRIBUTIONS | M | SD | M | SD | M | SD | M | SD | M | SD | M | SD |
| 1. Free will | 6.41 | 0.83 | 6.46 | 0.80 | 5.56 | 1.45 | 6.23 | 0.98 | 5.93 | 1.18 | 6.25 | 1.05 |
| 2. Moral responsibility | 5.23 | 1.56 | 5.5 | 1.51 | 3.80 | 1.55 | 4.65 | 1.66 | 2.79 | 1.81 | 3.49 | 1.99 |
| 3. Regret | 5.80 | 1.32 | 6.54 | 0.91 | 3.26 | 1.93 | 5.54 | 1.49 | 5.38 | 1.75 | 6.22 | 1.26 |
[i] Note: Scales are between 1 and 7.
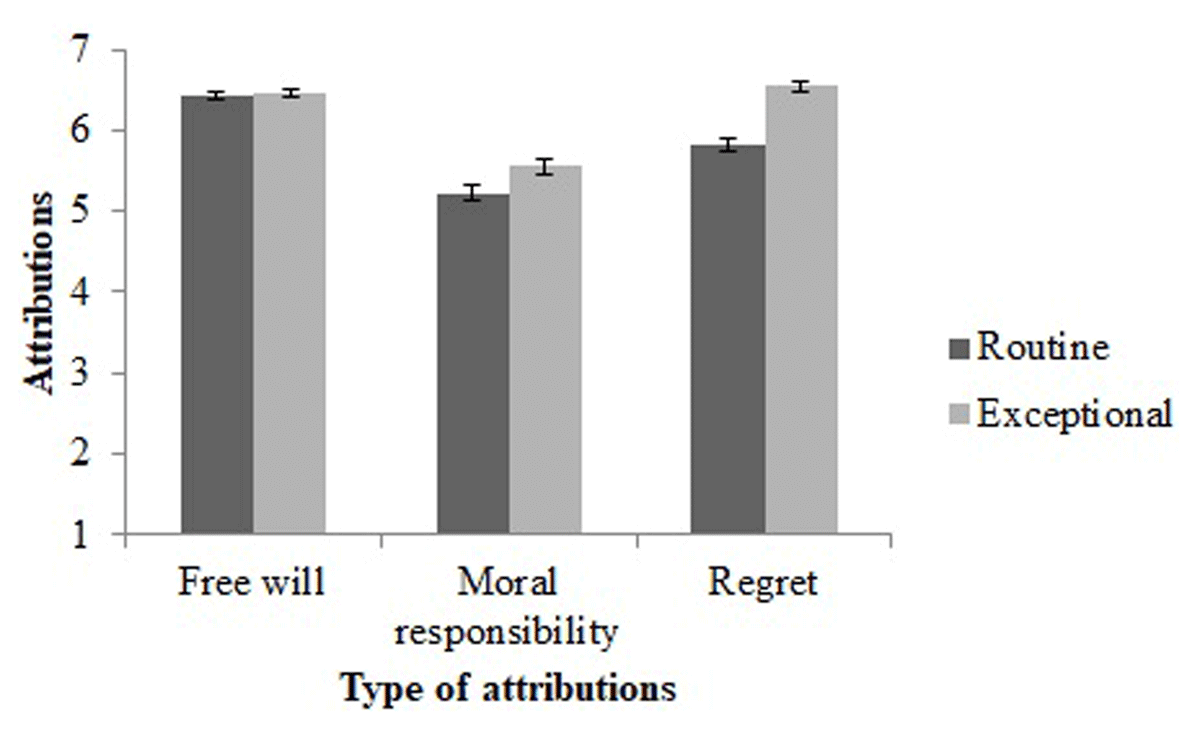
Figure 2
Attributions of free will, moral responsibility, and regret in the function of the type of event (Routine vs. Exceptional) for the hitchhiker scenario. Error bars indicate ± 1 SEM.
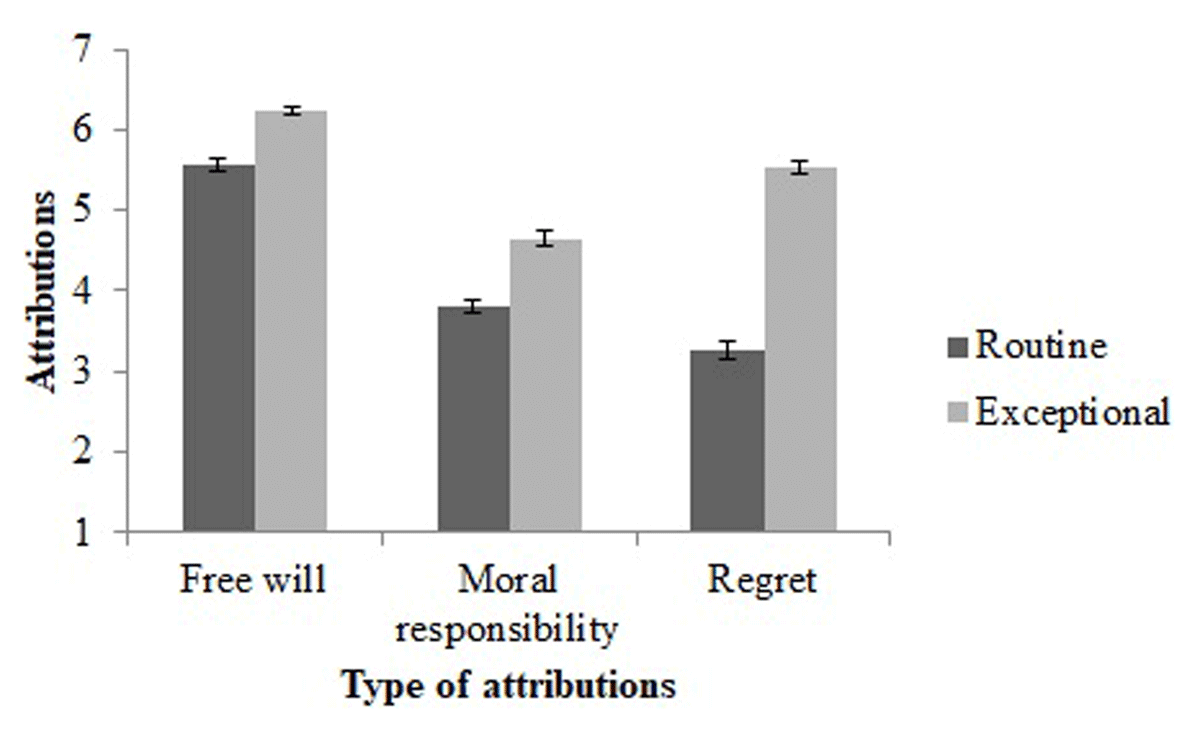
Figure 3
Attributions of free will, moral responsibility, and regret in the function of the type of event (Routine vs. Exceptional) for the car accident scenario. Error bars indicate ± 1 SEM.
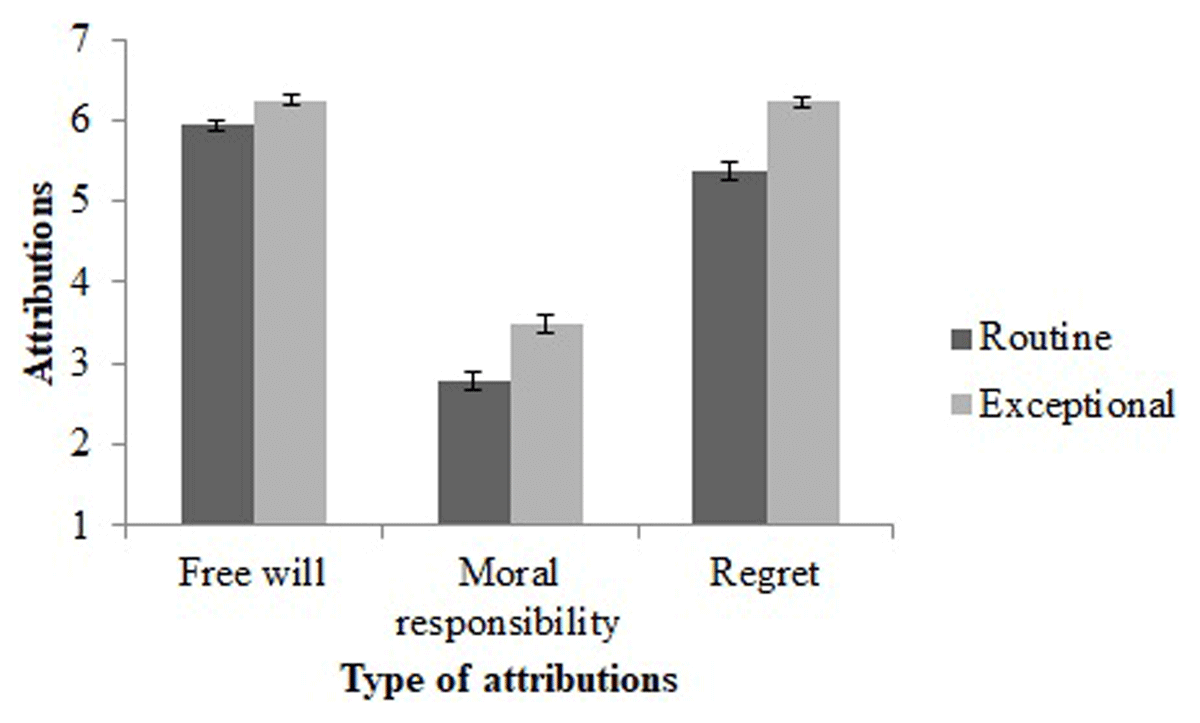
Figure 4
Attributions of free will, moral responsibility, and regret in the function of the type of event (Routine vs. Exceptional) for the convenience store scenario. Error bars indicate ± 1 SEM.
Table 2
Means, standard deviations, and bivariate correlations (with 95% confidence intervals) for all dependent variables in each scenario.
| SCENARIO | HITCHHIKER | ||||
|---|---|---|---|---|---|
| ATTRIBUTIONS | M | SD | 1 | 2 | 3 |
| 1. Free will | 6.44 | 0.81 | – | ||
| 2. Moral responsibility | 5.39 | 1.54 | 0.24*** [0.16, 0.31] | – | |
| 3. Regret | 6.17 | 1.19 | 0.42*** [0.35, 0.49] | 0.36*** [0.28, 0.43] | – |
| SCENARIO | CAR ACCIDENT | ||||
| ATTRIBUTIONS | M | SD | 1 | 2 | 3 |
| 1. Free will | 5.90 | 1.28 | – | ||
| 2. Moral responsibility | 4.23 | 1.66 | 0.24*** [0.16, 0.31] | – | |
| 3. Regret | 4.40 | 2.06 | 0.20*** [0.12, 0.28] | 0.48*** [0.41, 0.54] | – |
| SCENARIO | CONVENIENCE STORE | ||||
| ATTRIBUTIONS | M | SD | 1 | 2 | 3 |
| 1. Free will | 6.09 | 1.13 | – | ||
| 2. Moral responsibility | 3.14 | 1.93 | 0.05 [–0.04, 0.13] | – | |
| 3. Regret | 5.80 | 1.58 | 0.34*** [0.27, 0.41] | 0.21*** [0.12, 0.28] | – |
[i] Notes: N = 561. Scales are between 1 and 7. *** p < 0.001.
Table 3
Independent samples Welch t-tests contrasting the routine versus exceptional type of event for each scenario.
| DEPENDENT VARIABLE | t | df | p | d |
|---|---|---|---|---|
| HITCHHIKER SCENARIO | ||||
| Routine versus exceptional event | ||||
| Free will attributions | 0.69 | 558.44 | 0.245 | 0.06 [–0.10, 0.23] |
| Moral responsibility attributions | 2.51 | 558.83 | 0.006 | 0.21 [0.04, 0.37] |
| Regret attributions | 7.66 | 498.66 | <0.001 | 0.65 [0.48, 0.82] |
| CAR ACCIDENT SCENARIO | ||||
| Routine versus exceptional event | ||||
| Free will attributions | 6.41 | 488.38 | <0.001 | 0.54 [0.37, 0.71] |
| Moral responsibility attributions | 6.25 | 557.02 | <0.001 | 0.53 [0.36, 0.70] |
| Regret attributions | 15.68 | 523.73 | <0.001 | 1.32 [1.14, 1.51] |
| CONVENIENCE STORE SCENARIO | ||||
| Routine versus exceptional event | ||||
| Free will attributions | 3.32 | 550.30 | <0.001 | 0.29 [0.12, 0.45] |
| Moral responsibility attributions | 4.42 | 553.98 | <0.001 | 0.37 [0.20, 0.54] |
| Regret attributions | 6.57 | 506.06 | <0.001 | 0.55 [0.38, 0.72] |
[i] Notes: d = Cohen’s d; Values in brackets are 95% confidence intervals (CIs).
Table 4
Descriptive statistics for all conditions.
| TYPE OF UNIVERSE | DETERMINISTIC (n = 65) | INDETERMINISTIC (n = 63*) | TOTAL | |||||||||
|---|---|---|---|---|---|---|---|---|---|---|---|---|
| TYPE OF EVENT | ROUTINE | EXCEPTIONAL | r | ROUTINE | EXCEPTIONAL | r | ||||||
| ATTRIBUTIONS | M | SD | M | SD | M | SD | M | SD | M | SD | ||
| Free will | 4.64 | 1.74 | 5.04 | 1.80 | 0.78 [0.66, 0.86] | 5.33 | 1.20 | 5.90 | 1.11 | 0.56 [0.36, 0.71] | 5.22 | 1.44 |
| Moral responsibility | 2.28 | 1.65 | 2.98 | 1.96 | 0.37 [0.14, 0.56] | 2.30 | 1.46 | 2.54 | 1.55 | .48 [0.27, 0.65] | 2.53 | 1.40 |
| Regret | 3.98 | 2.06 | 5.37 | 1.84 | 0.28 [0.04, 0.49] | 4.43 | 1.95 | 5.79 | 1.47 | 0.61 [0.43, 0.75] | 4.89 | 1.56 |
[i] Note: Scales are between 1 and 7. M = means, SD = standard deviation, and r = Pearson correlation coefficient. * For the attributions of free will only, the sample size is reduced from 63 to 62 due to a statistical outlier.
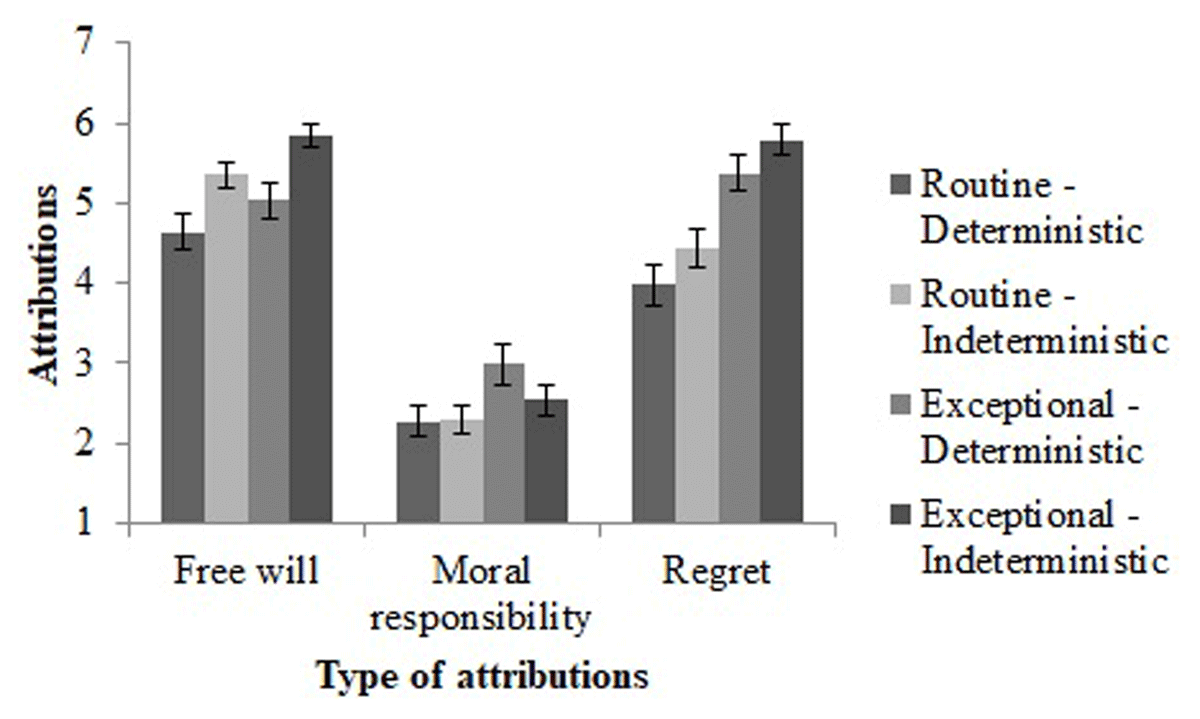
Figure 5
Attributions of free will, moral responsibility, and regret in the function of the type of event and the type of universe. Error bars indicate ± 1 SEM.
Table 5
Full results of 2 × 2 mixed ANOVA testing the effects of type of event and type of universe on attributions of free will, moral responsibility, and regret.
| ATTRIBUTIONS FACTOR | FREE WILL | MORAL RESPONSIBILITY | REGRET | ||||||||||||
|---|---|---|---|---|---|---|---|---|---|---|---|---|---|---|---|
| F | df | MSE | p | η2p | F | df | MSE | p | η2p | F | df | MSE | p | η2p | |
| Type of event | 22.95 | (1,125) | 0.65 | <0.001*** | 0.16 [0.07, 0.25] | 8.69 | (1,126) | 1.65 | 0.004** | 0.06 [0.01, 0.14] | 60.23 | (1,126) | 2.01 | <0.001*** | 0.32 [0.21, 0.42] |
| Type of universe | 9.80 | (1,125) | 3.86 | 0.002** | 0.07 [0.02, 0.15] | 0.72 | (1,126) | 3.93 | 0.398 | 0.01 [0.00, 0.05] | 2.51 | (1,126) | 4.80 | 0.115 | 0.02 [0.00, 0.08] |
| Type of event × Type of universe | 0.70 | (1,125) | 0.65 | 0.403 | 0.01 [0.00, 0.05] | 2.14 | (1,126) | 1.65 | 0.146 | 0.02 [0.00, 0.07] | <0.01 | (1.126) | 2.01 | 0.956 | <0.01 [0.00, 1] |
[i] Notes: df = degree of freedom, MSE = mean square error. Values in brackets indicate the confidence interval at 90%. ** p < 0.01. *** p < 0.001.