
Table 1
Results of the linear regression analyses on social proximity, trait ratings, and sympathy with gender norm, target, traditional masculinity beliefs (as measured through MRNI) and their interactions as predictors (Study 1).
| b | SE | t | p | 95% CI | |
|---|---|---|---|---|---|
| Social proximity | |||||
| Norm | –0.10 | 0.07 | –1.38 | .168 | [–0.24; 0.04] |
| Target | –0.12 | 0.07 | –1.70 | .091 | [–0.26; 0.02] |
| MRNI | –0.02 | 0.07 | –0.21 | .837 | [–0.16; 0.13] |
| Norm × Target | 0.04 | 0.07 | 0.52 | .601 | [–0.10; 0.18] |
| Norm × MRNI | 0.05 | 0.07 | 0.75 | .453 | [–0.09; 0.20] |
| Target × MRNI | 0.39 | 0.07 | 5.43 | <.001 | [0.25; 0.53] |
| Norm × Target × MRNI | 0.00 | 0.07 | 0.00 | 1.000 | [–0.14; 0.14] |
| Traits’ rating | |||||
| Norm | –0.06 | 0.11 | –0.54 | .589 | [–0.28; 0.16] |
| Target | –0.20 | 0.11 | –1.83 | .069 | [–0.42; 0.02] |
| MRNI | –0.09 | 0.11 | –0.78 | .437 | [–0.31; 0.13] |
| Norm × Target | 0.18 | 0.11 | 1.65 | .101 | [–0.04; 0.40] |
| Norm × MRNI | 0.11 | 0.11 | 0.94 | .349 | [–0.12; 0.33] |
| Target × MRNI | 0.51 | 0.11 | 4.53 | <.001 | [0.29; 0.73] |
| Norm × Target × MRNI | 0.08 | 0.11 | 0.69 | .493 | [–0.15; 0.30] |
| Sympathy | |||||
| Norm | –0.09 | 0.08 | –1.14 | .256 | [–0.24; 0.06] |
| Target | –0.16 | 0.08 | –2.01 | .046 | [–0.31; –0.00] |
| MRNI | –0.07 | 0.08 | –0.92 | .358 | [–0.23; 0.08] |
| Norm × Target | 0.03 | 0.08 | 0.44 | .658 | [–0.12; 0.19] |
| Norm × MRNI | –0.03 | 0.08 | –0.36 | .718 | [–0.18; 0.13] |
| Target × MRNI | 0.38 | 0.08 | 4.78 | <.001 | [0.22; 0.53] |
| Norm × Target × MRNI | 0.05 | 0.08 | 0.65 | .515 | [–0.10; 0.21] |
[i] Note: MRNI = Male Role Norms Scale.
Table 2
Results of the linear regression analyses on social proximity, trait ratings, and sympathy with gender norm, target, political orientation and their interactions as predictors (Study 1).
| b | SE | t | p | 95% CI | |
|---|---|---|---|---|---|
| Social proximity | |||||
| Norm | –0.05 | 0.08 | –0.70 | .488 | [–0.20; 0.10] |
| Target | –0.12 | 0.08 | –1.53 | .129 | [–0.27; 0.03] |
| PO | 0.01 | 0.05 | 0.20 | .842 | [–0.09; 0.12] |
| Norm × Target | 0.05 | 0.08 | 0.71 | .477 | [–0.10; 0.20] |
| Norm × PO | 0.02 | 0.05 | 0.33 | .740 | [–0.09; 0.12] |
| Target × PO | 0.14 | 0.05 | 2.66 | .009 | [0.04; 0.25] |
| Norm × Target × PO | 0.08 | 0.05 | 1.58 | .117 | [–0.02; 0.19] |
| Traits’ rating | |||||
| Norm | –0.01 | .11 | –0.10 | .924 | [–0.24; 0.22] |
| Target | –0.19 | .11 | –1.62 | .107 | [–0.41; 0.04] |
| PO | 0.01 | .08 | 0.06 | .949 | [–0.15; 0.16] |
| Norm × Target | 0.21 | .11 | 1.86 | .065 | [–0.01; 0.44] |
| Norm × PO | 0.05 | .08 | 0.58 | .562 | [–0.11; 0.20] |
| Target × PO | 0.12 | .08 | 1.52 | .131 | [–0.04; 0.28] |
| Norm × Target × PO | 0.18 | .08 | 2.28 | .024 | [0.02; 0.34] |
| Sympathy | |||||
| Norm | –0.02 | .08 | –0.27 | .784 | [–0.18; 0.14] |
| Target | –0.18 | .08 | –2.28 | .024 | [–0.34; –0.02] |
| PO | 0.03 | .06 | 0.51 | .611 | [–0.08; 0.14] |
| Norm × Target | 0.02 | .08 | 0.26 | .792 | [–0.14; 0.18] |
| Norm × PO | 0.01 | .06 | 0.14 | .885 | [–0.10; 0.12] |
| Target × PO | 0.10 | .06 | 1.78 | .076 | [–0.01; 0.21] |
| Norm × Target × PO | 0.12 | .06 | 2.12 | .036 | [0.01; 0.23] |
[i] Note: PO = Political orientation (from 1 = Very left-wing to 7 = Very right-wing).
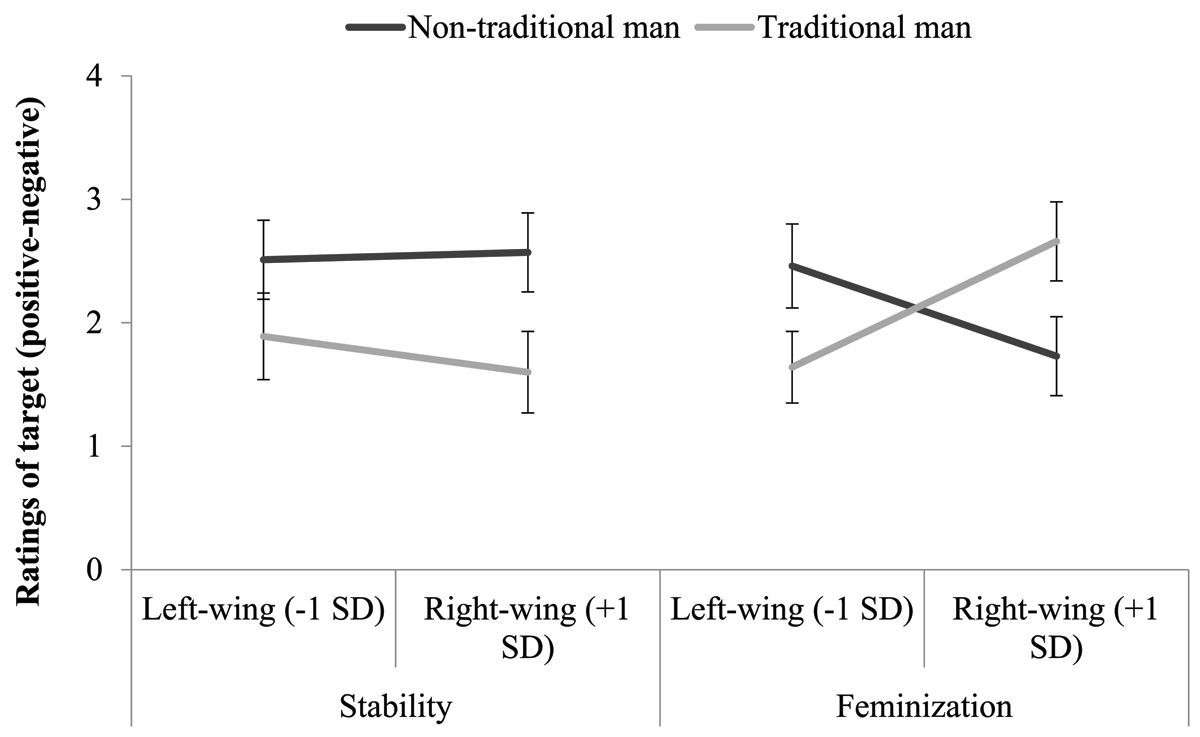
Figure 1
Trait ratings of the non-conforming man and the conforming man as a function of political orientation and men’s gender norm (Study 1). Higher scores indicate positive ratings. Error bars represent standard errors.

Figure 2
Sympathy for the non-traditional man and the traditional man as a function of political orientation and men’s norm (Study 1). Error bars represent standard errors.
Table 3
Results of the linear regression analyses on likeability, hiring intentions, and suggested salary with gender norm, target, traditional masculinity beliefs (as measured through MRNI) and their interactions as predictors (Study 2).
| b | SE | t | p | 95% CI | |
|---|---|---|---|---|---|
| Likeability | |||||
| Norm | –0.03 | 0.08 | –0.33 | .742 | [–0.18; 0.13] |
| Target | 0.14 | 0.08 | 1.73 | .087 | [–0.02; 0.29] |
| MRNI | –0.21 | 0.08 | –2.72 | .007 | [–0.36; –0.06] |
| Norm × Target | –0.01 | 0.08 | –0.13 | .895 | [–0.17; 0.15] |
| Norm × MRNI | –0.10 | 0.08 | –1.31 | .194 | [–0.25; 0.05] |
| Target × MRNI | 0.03 | 0.08 | 0.34 | .737 | [–0.13; 0.18] |
| Norm × Target × MRNI | 0.17 | 0.08 | 2.22 | .028 | [0.02; 0.32] |
| Hiring intentions | |||||
| Norm | –0.03 | 0.12 | –0.25 | .801 | [–0.27; 0.21] |
| Target | 0.23 | 0.12 | 1.95 | .054 | [–0.00; 0.47] |
| MRNI | –0.20 | 0.12 | –1.73 | .087 | [–0.43; 0.03] |
| Norm × Target | 0.06 | 0.12 | 0.52 | .602 | [–0.18; 0.30] |
| Norm × MRNI | 0.01 | 0.12 | 0.10 | .924 | [–0.22; 0.24] |
| Target × MRNI | –0.01 | 0.12 | –0.01 | .990 | [–0.23; 0.23] |
| Norm × Target × MRNI | 0.18 | 0.12 | 1.57 | .118 | [–0.04; 0.41] |
| Salary | |||||
| Norm | –0.03 | 0.13 | –0.25 | .806 | [–0.29; 0.22] |
| Target | –0.14 | 0.13 | –1.08 | .282 | [–0.39; 0.12] |
| MRNI | –0.05 | 0.13 | –0.38 | .707 | [–0.29; 0.20] |
| Norm × Target | 0.06 | 0.13 | 0.47 | .639 | [–0.20; 0.30] |
| Norm × MRNI | 0.05 | 0.13 | 0.39 | .696 | [–0.20; 0.30] |
| Target × MRNI | 0.10 | 0.13 | 0.83 | .408 | [–0.14; 0.35] |
| Norm × Target × MRNI | 0.04 | 0.13 | 0.32 | .747 | [–0.21; 0.29] |
[i] Note: MRNI = Male Role Norms Scale.
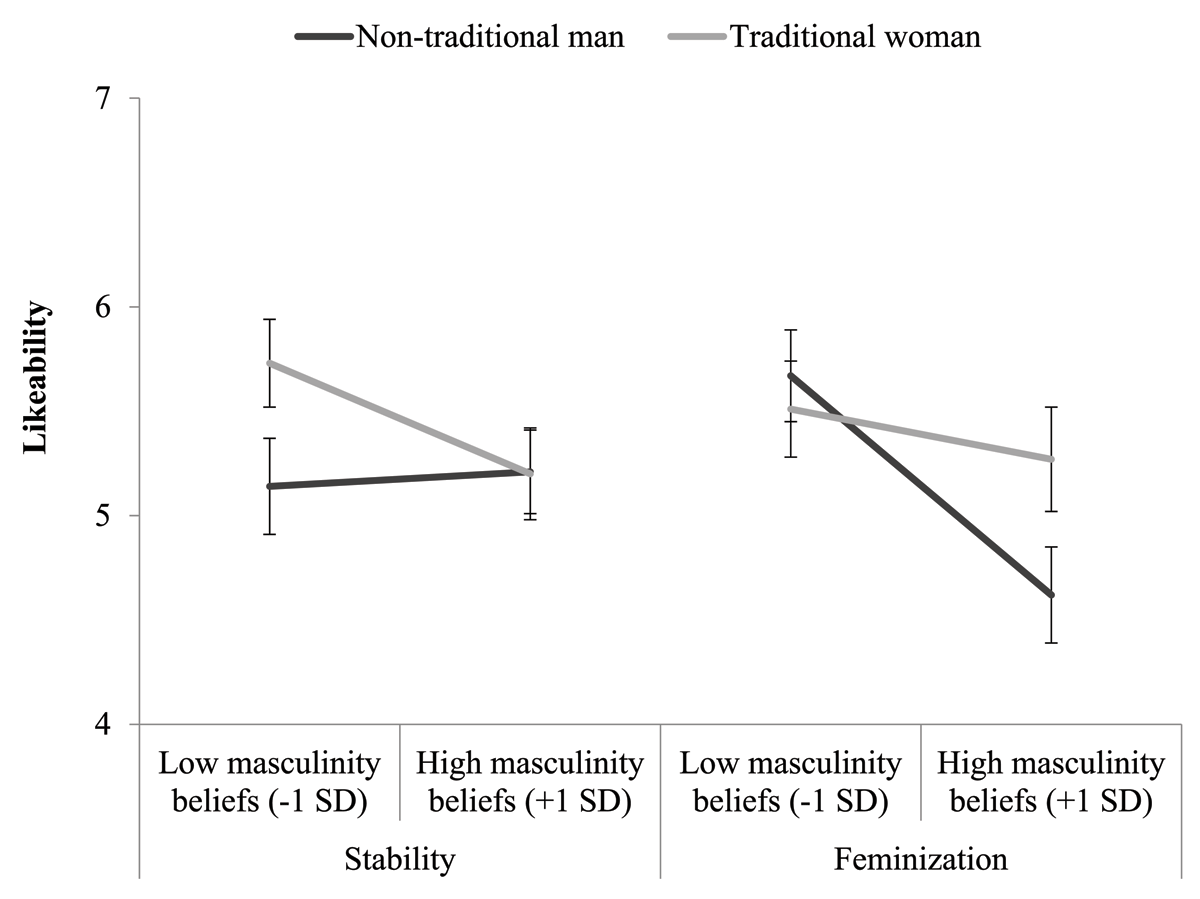
Figure 3
Likeability of the non-traditional man and the traditional woman as a function of traditional masculinity beliefs and men’s norm (Study 2). Error bars represent standard errors.
Table 4
Results of the linear regression analyses on likeability, hiring intentions, and suggested salary with gender norm, target, political orientation and their interactions as predictors (Study 2).
| b | SE | t | p | 95% CI | |
|---|---|---|---|---|---|
| Likeability | |||||
| Norm | –0.00 | 0.08 | –0.02 | .985 | [–0.16; 0.16] |
| Target | 0.14 | 0.08 | 1.70 | .092 | [–0.02; 0.30] |
| PO | –0.06 | 0.06 | –1.04 | .299 | [0.05; 0.01] |
| Norm × Target | –0.04 | 0.08 | 0.42 | .673 | [–0.20; 0.13] |
| Norm × PO | 0.02 | 0.06 | 0.35 | .728 | [–0.09; 0.13] |
| Target × PO | 0.04 | 0.06 | 0.77 | .445 | [–0.07; 0.16] |
| Norm × Target × PO | 0.09 | 0.06 | 1.66 | .099 | [–0.02; 0.2] |
| Hiring intentions | |||||
| Norm | 0.02 | .12 | 0.18 | .860 | [–0.22; 0.26] |
| Target | 0.21 | .12 | 1.70 | .092 | [–0.03; 0.45] |
| PO | –0.18 | .08 | –2.19 | .030 | [–0.35; –0.02] |
| Norm × Target | –0.01 | .12 | –0.07 | .941 | [–0.25; 0.23] |
| Norm × PO | –0.04 | .08 | –0.50 | .615 | [–0.21; 0.12] |
| Target × PO | 0.13 | .08 | 1.59 | .115 | [–0.03; 0.30] |
| Norm × Target × PO | 0.11 | .08 | 1.36 | .175 | [–0.05; 0.28] |
| Salary | |||||
| Norm | –0.04 | .13 | –0.33 | .742 | [–0.30; 0.22] |
| Target | –0.14 | .13 | –1.08 | .281 | [–0.40; 0.12] |
| PO | 0.09 | .09 | 0.97 | .332 | [–0.09; 0.27] |
| Norm × Target | 0.05 | .13 | 0.40 | .690 | [–0.21; 0.31] |
| Norm × PO | –0.09 | .09 | –0.94 | .347 | [–0.26; 0.09] |
| Target × PO | –0.05 | .09 | –0.59 | .555 | [–0.23; 0.13] |
| Norm × Target × PO | 0.06 | .09 | 0.63 | .530 | [–0.12; 0.24] |
[i] Note: PO = Political orientation (from 1 = Very left-wing to 7 = Very right-wing).
Table 5
Small-scale meta-analyses on the results of the two studies.
| Target × Norm × Traditional masculinity | |||||||||
|---|---|---|---|---|---|---|---|---|---|
| Not controlling for political orientation | Controlling for political orientation | ||||||||
| Dependent variable | B | SE | N | p | B | SE | N | p | |
| Social proximity (Study 1) | 0.00 | 0.07 | 189 | 1.000 | –0.00 | 0.08 | 184 | .979 | |
| Traits’ rating (Study 1) | 0.08 | 0.11 | 190 | .493 | –0.03 | 0.14 | 185 | .807 | |
| Sympathy (Study 1) | 0.05 | 0.08 | 190 | .515 | 0.01 | 0.09 | 195 | .951 | |
| Likeability (Study 2) | 0.17 | 0.08 | 148 | .028 | 0.17 | 0.10 | 147 | .076 | |
| Hiring intentions (Study 2) | 0.18 | 0.12 | 145 | .118 | 0.14 | 0.15 | 144 | .353 | |
| Salary (Study 2) | 0.04 | 0.13 | 146 | .408 | 0.23 | 0.15 | 145 | .140 | |
| Metaeffect | 0.08 | 0.04 | .038 | 0.07 | 0.04 | .133 | |||
| Target × Norm × Political orientation | |||||||||
| Not controlling for traditional masculinity | Controlling for traditional masculinity | ||||||||
| Dependent variable | B | SE | N | p | B | SE | N | p | |
| Social proximity (Study 1) | 0.08 | 0.05 | 184 | .117 | 0.12 | 0.06 | 184 | .036 | |
| Traits’ rating (Study 1) | 0.18 | 0.08 | 185 | .024 | 0.20 | 0.09 | 185 | .028 | |
| Sympathy (Study 1) | 0.12 | 0.06 | 185 | .036 | 0.16 | 0.06 | 185 | .008 | |
| Likeability (Study 2) | 0.09 | 0.06 | 147 | .099 | 0.05 | 0.06 | 147 | .421 | |
| Hiring intentions (Study 2) | 0.11 | 0.08 | 144 | .175 | 0.10 | 0.09 | 144 | .298 | |
| Salary (Study 2) | 0.06 | 0.09 | 145 | .555 | 0.03 | 0.10 | 145 | .790 | |
| Metaeffect | 0.10 | 0.03 | < .001 | 0.11 | 0.03 | < .001 | |||