
Table 1
Means, standard deviations and correlations for all Study 1 variables.
| Maj | Min | M (SD) | 1 | 2 | 3 | 4 | |
|---|---|---|---|---|---|---|---|
| Group status | – | – | 0.84 (.37) | – | 0.22** | 0.17** | 0.06* |
| Prototypicality | 5.12 | 4.40 | 4.99 (1.20) | – | 0.60** | 0.09** | |
| National solidarity | 5.67 | 5.14 | 5.57 (1.10) | – | 0.13** | ||
| Adherence | 6.21 | 6.09 | 6.19 (0.78) | – |
[i] Notes. Group status refers to Majority and Minority and does not necessarily imply any hierarchical relationship between the groups. Maj = Majority, Min = Minority. * p < 0.05, ** p < 0.01.
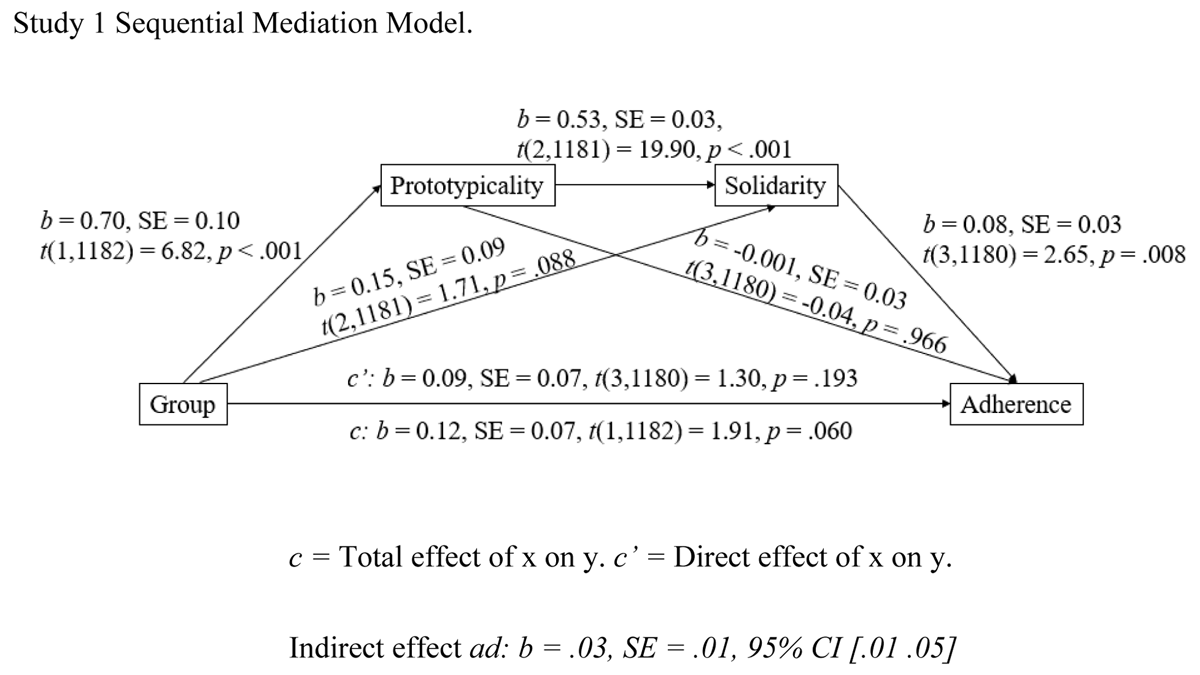
Figure 1
Sequential mediation of the effect of majority/minority group status on adherence to COVID-19 health advice mediated via prototypicality and national solidarity.
Table 2
Means, standard deviations and correlations for all Study 2 variables.
| Maj | Min | M (SD) | 1 | 2 | 3 | 4 | |
|---|---|---|---|---|---|---|---|
| Group status | – | – | 0.66 (0.47) | – | 0.10* | <.001 | –0.09* |
| Prototypicality | 4.87 | 4.58 | 4.77 (1.34) | – | 0.56** | 0.14** | |
| National solidarity | 5.40 | 5.40 | 5.39 (1.32) | – | 0.30** | ||
| Adherence | 5.54 | 5.75 | 5.57 (1.09) | – |
[i] Notes. Group status refers to Majority and Minority and does not necessarily imply any hierarchical relationship between the groups. Maj = Majority, Min = Minority. * p < 0.05, ** p < 0.01.
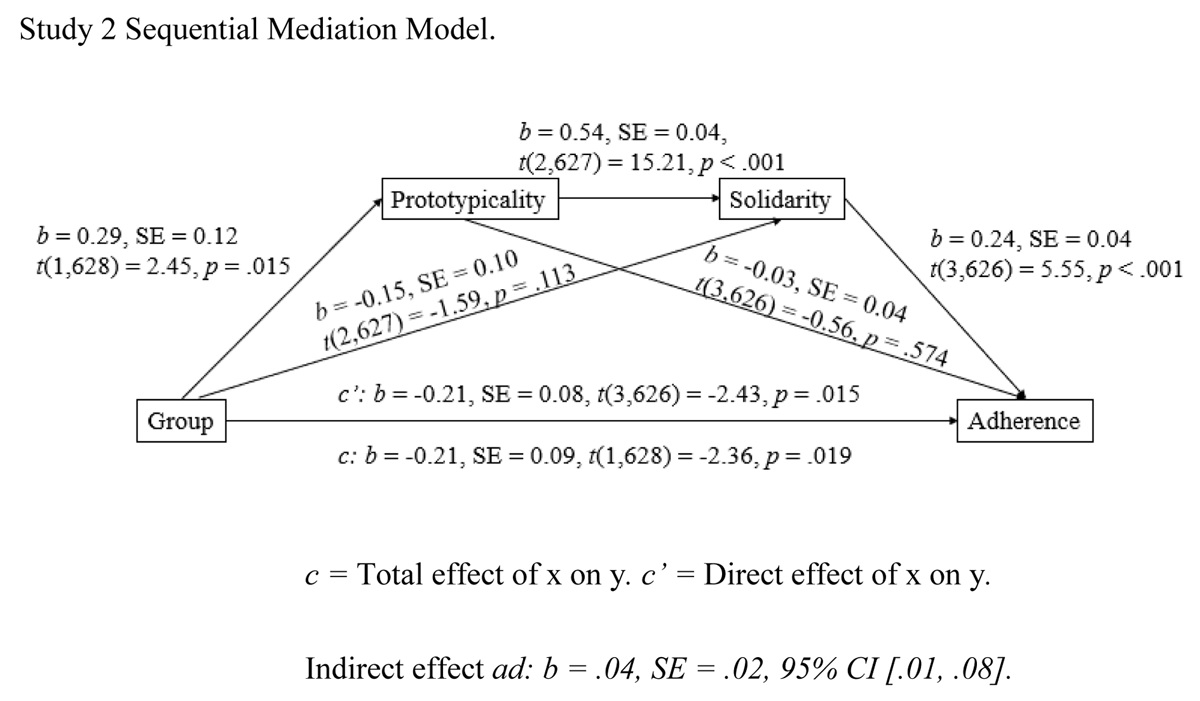
Figure 2
Sequential mediation of the effect of majority/minority group status on adherence to COVID-19 health advice mediated via prototypicality and national solidarity.
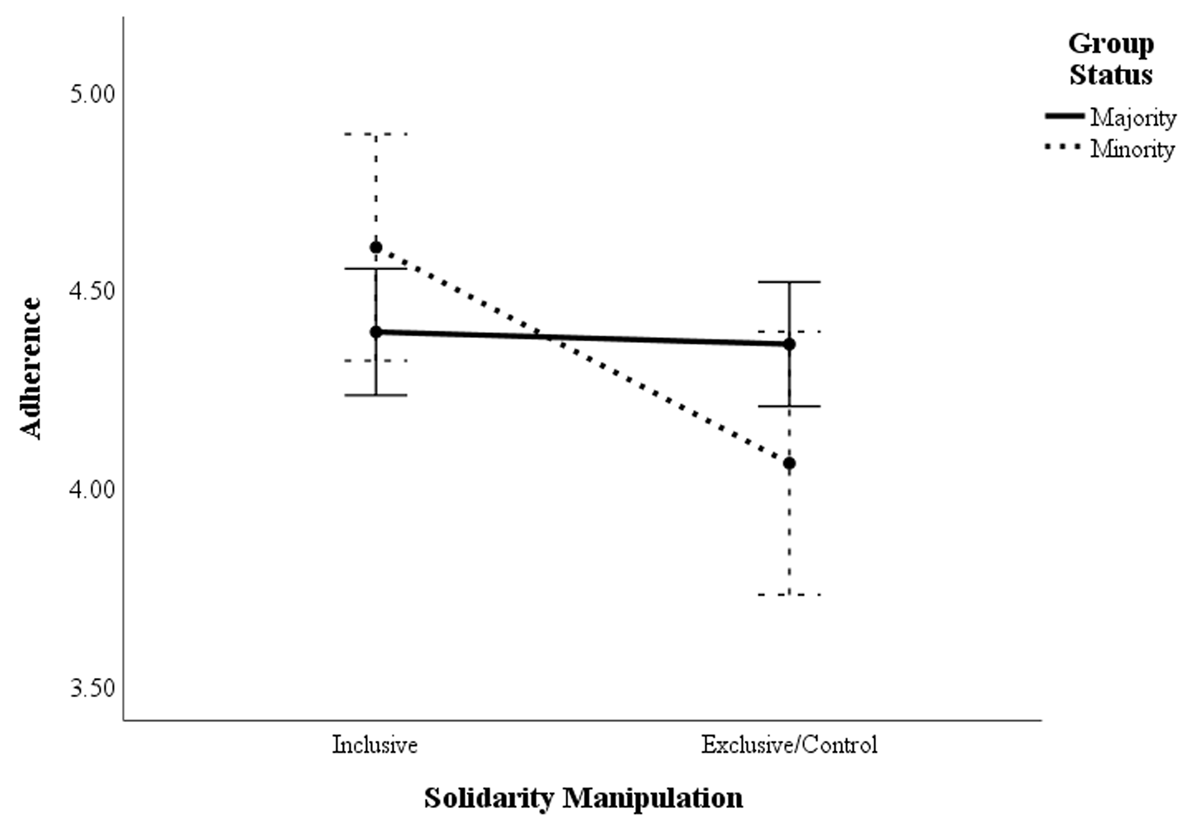
Figure 3
Minority group members in the inclusive solidarity messaging group reported greater adherence to COVID-19 guidelines compared to those who heard the exclusive message.