
Table 1
The measurement model obtained from a series of Confirmatory Factor Analyses.
| Model | χ2 | Δ χ2 | CFI | TLI | RMSEA | SRMR |
|---|---|---|---|---|---|---|
| Model A: 4-factor solution representations, guilt, reparations, identity | 1194.788 (164)*** | 0.861 | 0.839 | 0.091 | 0.074 | |
| Model B: 5-factor solution positive representations, negative representations, guilt, reparations, identity | 1052.014 (160)*** | 142.774*** | 0.879 | 0.857 | 0.085 | 0.069 |
| Model C: 6-factor solution positive representations, negative representations, guilt, apology, reparations, identity | 832.375 (155)*** | 219.639*** | 0.908 | 0.888 | 0.076 | 0.062 |
| Model D: 7-factor solution positive representations, negative representations, guilt, apology, reparations in NL, reparations in former colonies, identity | 638.291 (149)*** | 194.084*** | 0.934 | 0.916 | 0.066 | 0.056 |
| Model E: 7-factor solution Similar to Model D, first item of positive representations removed | 395.522 (131)*** | 242.769*** | 0.963 | 0.951 | 0.051 | 0.039 |
[i] Note: χ2 = Chi Square; Δχ2 = Chi Square Difference Test; CFI = Comparative Fit Index; TLI = Tucker Lewis Index; RMSEA = Root Mean Square Error of Approximation; SRMR = Standardized Root Mean Square Residual; *** p < 0.001.
Table 2
Descriptive statistics of the latent variables used in the analysis (N = 763).
| Range | Mean | SD | Wald-test | |
|---|---|---|---|---|
| Political apology | 1–7 | 2.79 | 1.35 | 359.39*** |
| Reparations to colonial minorities in NL | 1–7 | 3.25 | 1.09 | 163.19*** |
| Reparations in the former colonies | 1–7 | 3.23 | 1.37 | 150.94*** |
| Positive representations | 1–7 | 4.74 | 0.79 | 272.23*** |
| Negative representations | 1–7 | 5.33 | 0.78 | 839.81*** |
| Group-based guilt | 1–7 | 2.95 | 1.50 | 223.89*** |
| In-group identification | 1–7 | 5.70 | 1.13 | 1136.05*** |
[i] Note: Measurement model identified using reference items, *** p < 0.001. Wald tests χ2(1) against the mid-point of the scale (4). NL = The Netherlands.
Table 3
Correlations between the latent variables (N = 763).
| 1 | 2 | 3 | 4 | 5 | 6 | |
|---|---|---|---|---|---|---|
| 1. Political apology | ||||||
| 2. Reparations to colonial minorities in NL | 0.708*** | |||||
| 3. Reparations in the former colonies | 0.594*** | 0.769*** | ||||
| 4. Positive representations | –0.223*** | –0.172*** | –0.208*** | |||
| 5. Negative representations | 0.298*** | 0.228*** | 0.291*** | –0.270*** | ||
| 6. Group-based guilt | 0.720*** | 0.525*** | 0.526*** | –0.298*** | 0.302*** | |
| 7. In-group identification | –0.114* | –0.134† | –0.062 | 0.194*** | –0.114† | –0.029 |
[i] Note: NL = The Netherlands. † p < 0.10, * p < 0.05, *** p < 0.001.
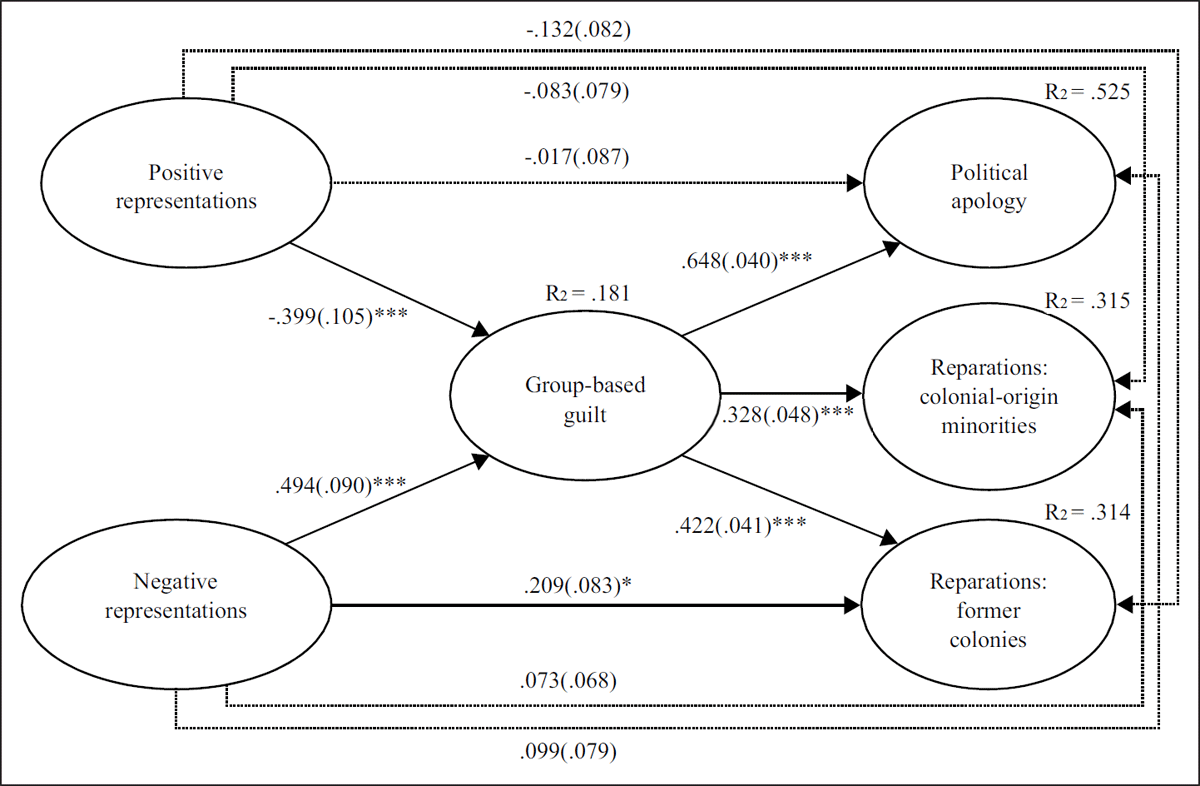
Figure 1
Findings from a structural equation model for the mediation analysis (N = 763).
Note: Model fit: χ2(df) = 575.356 (176), p < 0.001, CFI = 0.945, TLI = 0.929, RMSEA = 0.055, SRMR = 0.047. Unstandardized estimates are presented with S.E. in brackets. Nonsignificant paths are presented as dotted lines. Error covariances between the three dependent variables as well as between the two independent variables were accounted for. Control variables age, gender, education, and national identification, were included in the model. * p < 0.05, ** p < 0.01, *** p < 0.001.
Table 4
Decomposition of total, direct and indirect effects from the mediation model (N = 763).
| Political apology | Reparations to colonial minorities in the Netherlands | Reparations in the former colonies | ||||
|---|---|---|---|---|---|---|
| B | SE | B | SE | B | SE | |
| Positive representations | ||||||
| Total effect | –0.275* | 0.107 | –0.214* | 0.085 | –0.300** | 0.095 |
| Direct effect | –0.017 | 0.087 | –0.083 | 0.079 | –0.132 | 0.082 |
| Indirect effect | –0.258*** | 0.069 | –0.131** | 0.039 | –0.168*** | 0.046 |
| CI Indirect effect | [–0.394, –0.122] | [–0.208, –0.054] | [–0.258, –0.079] | |||
| Negative representations | ||||||
| Total effect | 0.418*** | 0.096 | 0.235** | 0.080 | 0.418*** | 0.087 |
| Direct effect | 0.099 | 0.079 | 0.073 | 0.068 | 0.209* | 0.083 |
| Indirect effect | 0.320*** | 0.062 | 0.162*** | 0.040 | 0.208*** | 0.044 |
| CI Indirect effect | [0.199, 0.441] | [0.084, 0.240] | [0.123, 0.294] | |||
[i] Note: Unstandardized coefficients presented. CI = confidence interval. Bootstrapping with 5000 replacement samples applied. * p < 0.05, ** p < 0.01, *** p < 0.001.
Table 5
Unstandardized regression coefficients for the control variables in the mediation model (N = 763).
| Political apology | Reparations to colonial minorities in the Netherlands | Reparations in the former colonies | Group-based guilt | |
|---|---|---|---|---|
| National identification | –0.106 (0.050)* | –0.133 (0.043)** | –0.042 (0.048) | 0.009 (0.061) |
| Female | –0.103 (0.094) | 0.028 (0.088) | –0.227 (0.092)* | 0.513 (0.108)*** |
| Age | 0.003 (0.004) | 0.008 (0.004)* | 0.009 (0.004)* | 0.005 (0.005) |
| Education | 0.009 (0.032) | 0.088 (0.027)** | 0.096 (0.032)** | –0.056 (0.039) |
[i] Note: Fit statistics: χ2(df) = 575.356 (176)***, CFI = 0.945, TLI = 0.929, RMSEA = 0.055, SRMR = 0.047. Standard errors in the brackets. * p < 0.05, ** p < 0.01, *** p < 0.001.